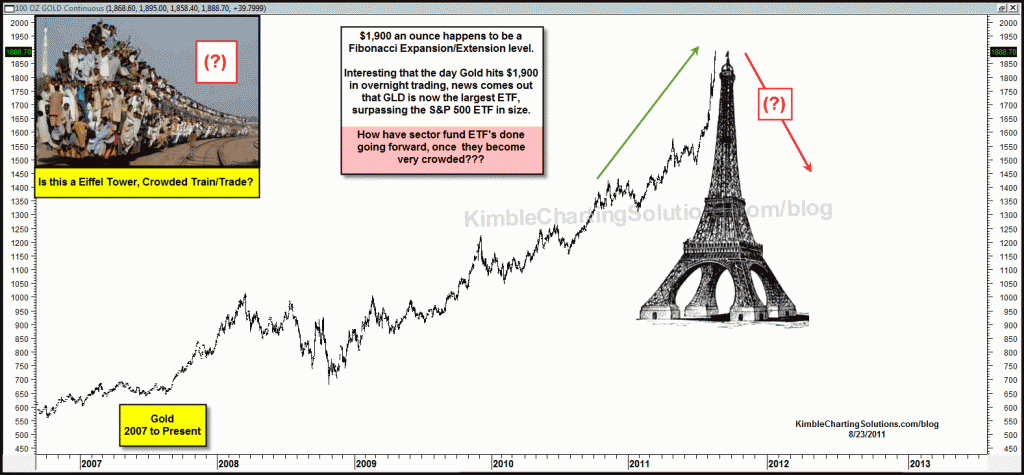
All aboard! Is their room for anyone else on this train?
When it comes to investing, Crowded Trains/Crowded Trades often lead to patterns that look much like the Eiffel Tower. A few examples of Eiffel tower patterns over the past 10 years can be seen below…
CLICK ON CHART TO ENLARGE
The point of these charts is…. if you see the left side of the Eiffel tower in a chart, odds favor you will see the right side of the tower as well, some where down the line!
As investors we are blessed to live in a time that investment tools are available (to the majority of investors), that allow us to take advantage of both sides of the Eiffel tower pattern. My favorite chart pattern is the rising wedge pattern. Which two-thirds of the time leads to a decline in prices. The Eiffel tower pattern usually forms a rising wedge before the drop takes place.
If you can find a rising wedge and a very crowded Train/Trade, odds move even higher that upon a support line break, a sizable decline will take place.
Are we in the early stages of another Eiffel tower pattern below?
CLICK ON CHART TO ENLARGE
Fibonacci expansion/extension tools have suggested that Gold should rally up to $1,900 per ounce and then find some resistance at these levels (see Gold Fibonacci target post) In overnight trading, Gold futures did poke above the $1,900 target level and then moved a little lower. At the same time Gold was hitting a potential key level, the CBNC today was running a story highlighting that GLD had surpassed the S&P 500 ETF as the largest ETF in World!!! (see article here) .
Only time will tell if channel and Fibonacci resistance will cause even a slight slow down in Golds upward movement.
Remember…. If history is any kind of guide, if you see the left side of the Eiffel tower, somewhere down the line, you will see the right side of the tower too!


Hats off to kimble as gold and silver falling from eiffel tower gr8 analysis.
Add Silver to the list…
Agree- doesn’t look pretty. However, if you invert 10yr T’s yield, I’d guess looks the same?
If not gold, and not T’s…only truly unloved asset I see is the Dollar??? If folks are going to pull their safest of safest, where are they going to put it???
Isto…..shared with premium members to watch the “A” stocks…being Apple and Amazon, which since mid-2007, are both up over 100% and the S&P 500 is down…. both are on key support.
Thanks for the comment and sharing.
Chris
descending triangle forming over 4 weeks in AAPL ?
what’s your opinion, chris ?