CLICK ON CHART TO ENLARGE
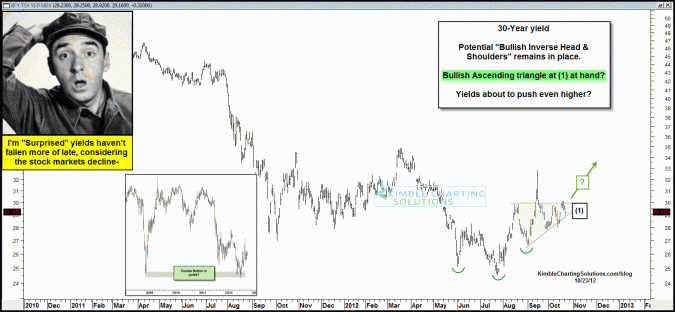
The yield on the 30-year bond (TYX) may have created a double bottom in July, matching the financial crisis low in yields (see inset chart above). Since then the 30-year yield may have created a “Bullish inverse head & shoulders” pattern.
Over the last couple of months yields look to be forming a bullish ascending triangle at (1) above. The spike in yields above the ascending triangle took place the “day QE3” was announced!
These patterns have not proven themselves, yet the potential that they are correct is there. I don’t know about you, I am surprised that yields haven’t fallen more of late, along with the stock market!
A breakdown of the ascending triangle would greatly reduce the idea of the inverse & head shoulders pattern in yields!
–


Just an observation – chart looks a lot like Crude Oil since June 2012. Very Interesting.
Crude looks to be breaking down out of a possible H/S pattern – could be headed much lower.
Chris
You should not be surprised that the markets have not fallen more–As anybody that has been investing in global commodities or stock markets can tell you, today’s market, thanks to the massive deceit and fraud of global investment firms enabled by technological advances such as high frequency trading (HFT) algorithms, it is easier than ever for industry insiders to rig stock markets and commodity markets to trade in whichever direction they desire in the short-term–
there is your answer-