CLICK ON CHART TO ENLARGE
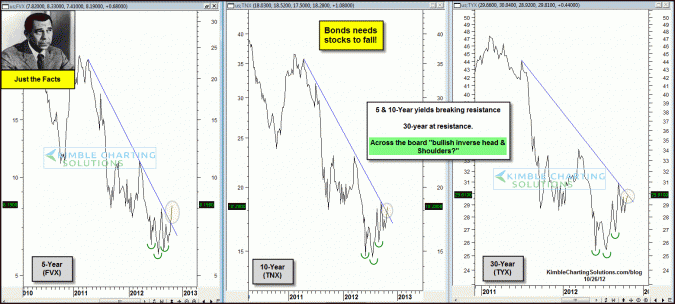
Short to longer-term Yields look to have created “Bullish Inverse Head & Shoulders” patterns over the past few months. (this is bullish for yields and bearish for govt.bond prices)
In the past couple of days the 5 & 10-year yield are pushing above falling resistance, with the 30-year, right at resistance.
A yield breakout, would mean the opposite for govt. bond prices.…they would be breaking support.
Joe Friday….if the inverse correlation between stocks and bonds remain true, Long bond holders would want stocks to fall here so bonds don’t fall further in value.
I shared the chart below with Premium & Sector/Commodity Sentiment Extreme members last week, reflecting that despite $800 billion flowing into the bond complex over the past few years, TLT is at the same price as it was in 2009!
CLICK ON CHART TO ENLARGE
Seem odd to you that the S&P 500 is up over 50% since 2009 yet OUTFLOWS have been almost $400 Billion!?!?!
At the same time inflows to the bond complex almost hit $900 billion, yet TLT is flat.
I feel like the guy the guy above….are you kidding me! My question would be this…what could happen to these products if the flows would reverse???
–


It looks like the Bernanke FED has been effective in “TWISTING” the market into a broken pricing mechanism. Does this mean the dollar is also “broke” or broken? That well may be. The buck now doesn’t pay any interest which is a thousands of years-old mechanism of a functioning currency, noted in written archeological records as old as civilization itself. That’s along record of history to refute, or is this time different?
Thanks for your excellent website and email alerts!!
SS