
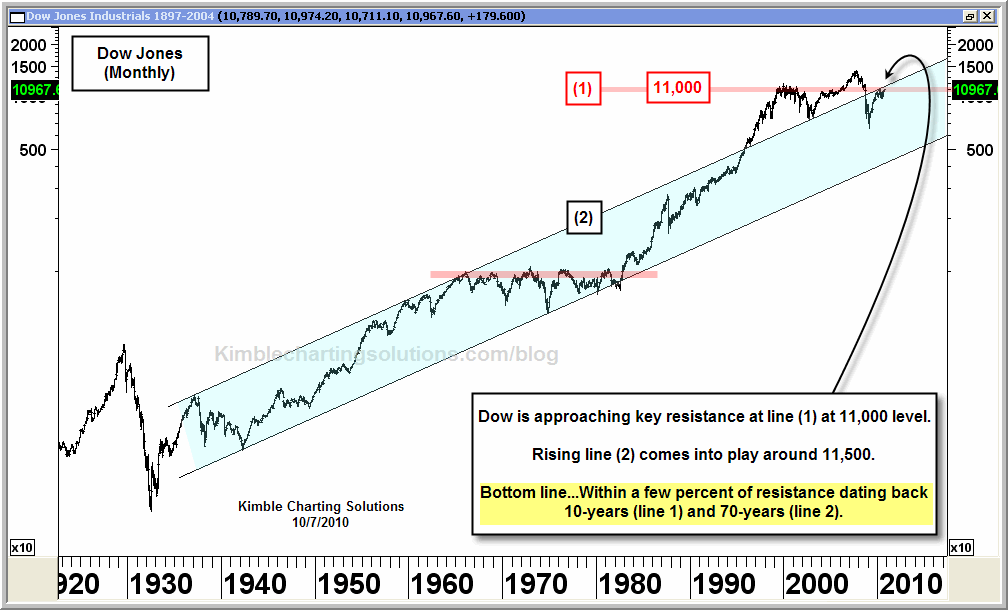
Per popular request, here is my updated 70-year Dow chart.
The rally off the September lows has brought the Dow Jones Industrial average to within a few percent of resistance dating back as far as 70 years.

Numerous times it has paid to harvest and raise cash along line (1) and then FOLLOW AN UPSIDE BREAKOUT! This time going to be any different?

Looks like a possible 11 year Head and Shoulders top in process to me (no, not the anti-dandruff shampoo). Either that or the long drawn out 1960’s – 1980’s, “going nowhere” chart. We can live with the latter, if it should transpire.
I am final, I am sorry, there is an offer to go on other way.
Greetings from the Speedy DNS
I wonder how this chart would look different if it was priced in Gold and not in Dollar. In other words if we price Gold based on inflation it should be above 2500 dollars per ounce. So, would that mean that the resitance level would be different? Would you please make the same chart based on Gold’s price for every one’s information, otherwise just looking at the above chart is really misleading.
Owesome conclusion. Despite economic factors do we see power of pattern ?
One big difference between the 1968-82 period and this one is inflation. Compared to the zero return of the S&P500 of the last ten years, the the 1970s look similar. But adjust them for inflation and the difference is substantial. In other words, we have not experienced the same degree of a bear market. At least not yet.