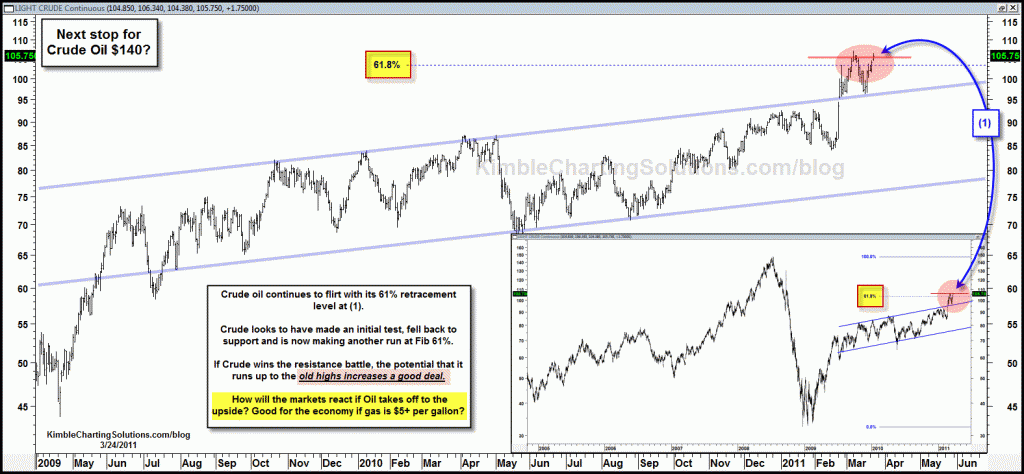
On 3/25 I shared in the chart below that Crude Oil was fighting with its 61% fib resistance level. (see post here) The chart directly below reflected that very little resistance between current prices and $140 was in place, should it break above the key level at (1).
CLICK ON CHART TO ENLARGE
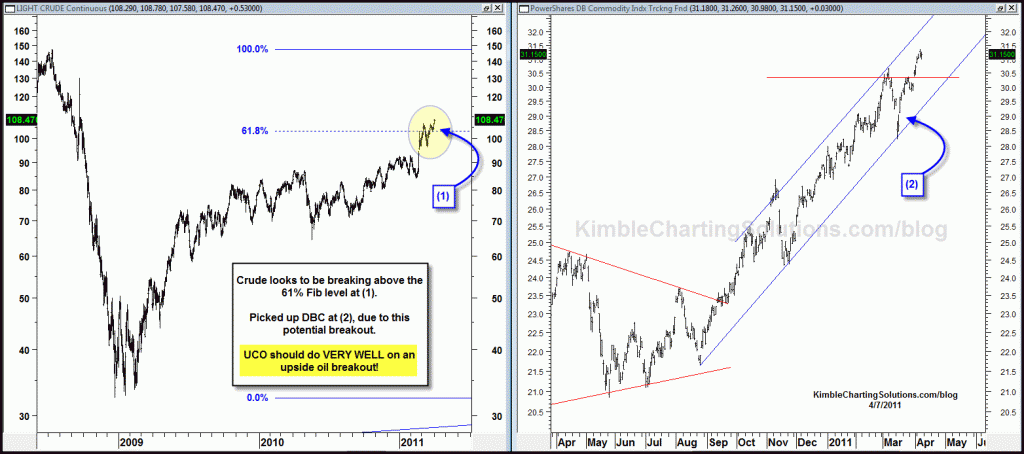
Below is an update to that chart, which reflects that Crude Oil looks to be breaking above this key level.
CLICK ON CHART TO ENLARGE
Will Crude Oil reach $140? I don’t know, yet a break above the 61% fib resistance level could see Crude run higher than many might think!
Game Plan….Have been an owner of DBC (which has oil exposure) for a while, due to its pattern at (2). (see post here) VERY AGGRESSIVE investors will want to look into UCO on this upside break in Oil. Keep in mind this is a 2X ETF and for AGGRESSIVE investors only!
Should Crude push a good deal higher will it impact stocks? If you are long the 500 index I wouldn’t be a seller, yet I sure would respect this pattern in the 500 index, due to the Crude oil situation (see post here)


