Thanks for all of the great responses from around the world. Great to hear from the regular contributors and welcome to all of the first time quiz responders.
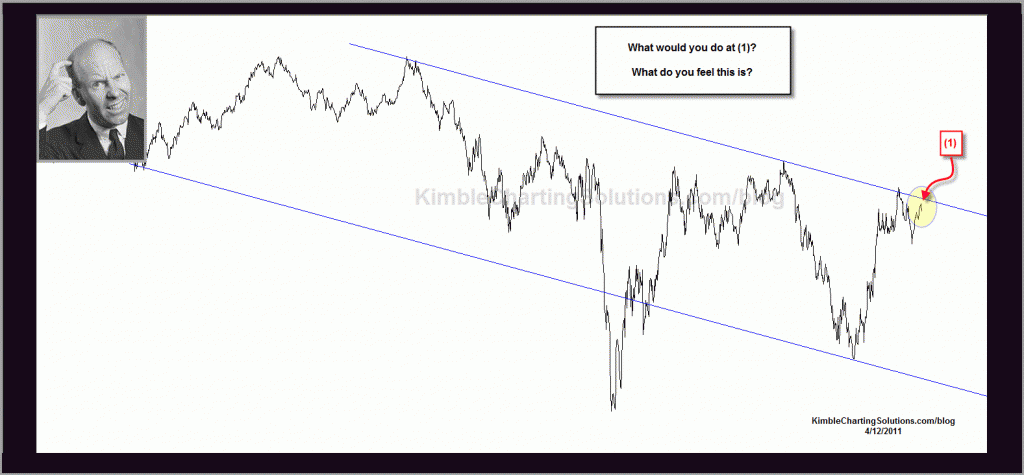
The vast majority of the responses figured out the chart had to do with bond yields, most thought it was the yield on the 30-year bond. Very close for sure! Most wanted to bet that yields would go higher at (1).
CLICK ON CHART TO ENLARGE
See quiz answer below…
CLICK ON CHART TO ENLARGE
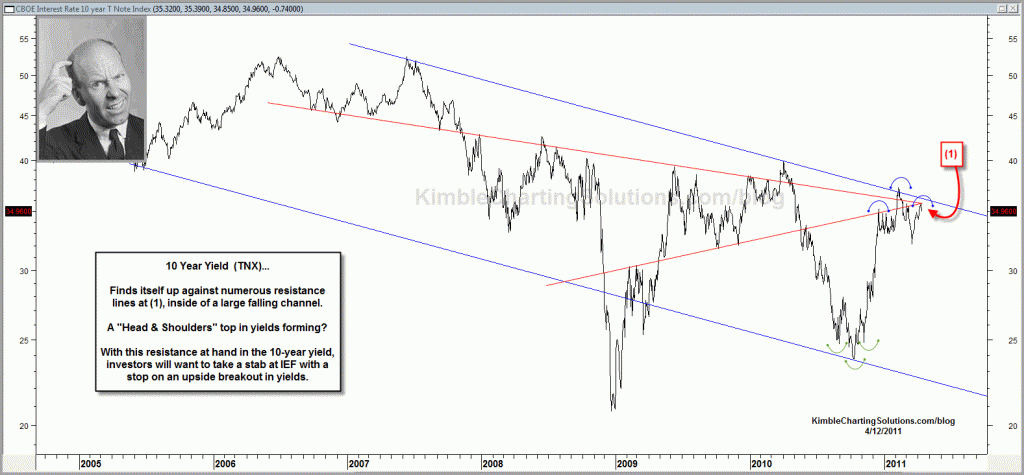
Quiz Answer….This chart is the yield on the 10-Year note. The yield is up against the top of a falling channel with several other resistance lines all coming into play at (1). At the same time a potential “bearish inverse head & shoulders” pattern could be at hand.
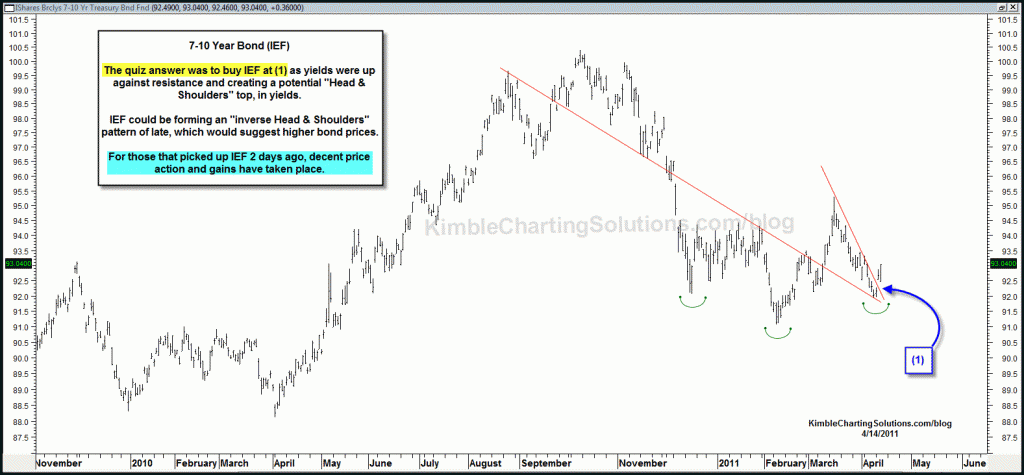
Game Plan….The “Power of the Pattern” was suggesting 2 days ago to buy IEF or TLT. For those that bought IEF 2 days ago, see updated chart action below.
CLICK ON CHART TO ENLARGE
Three days ago, yields were up against resistance as well as the 500 index and the POP (Power of the Pattern) was suggesting to harvest 500 positions. (see post here). Since this post, stocks have been a had a bumpy couple of days and bonds have rallied. If yields break to the upside of the falling channel/IEF breaks support at (1), the position will be sold and investors will want to short bonds!


