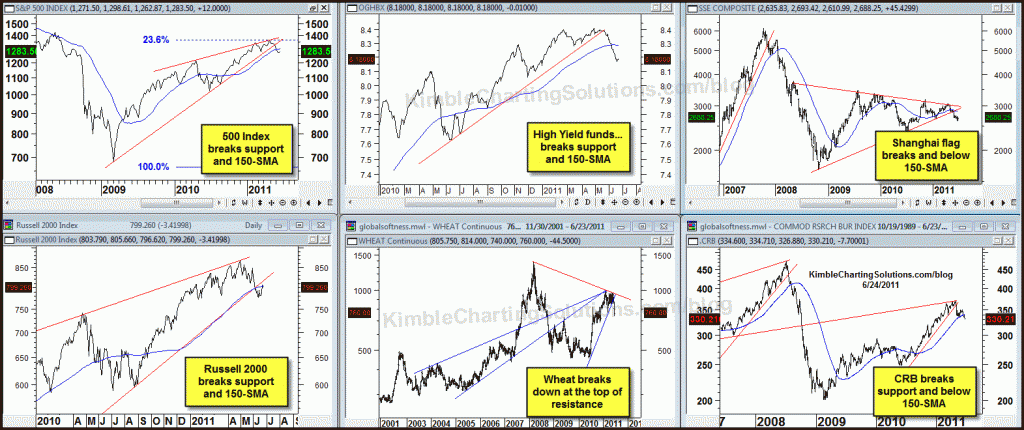
Below is a 6-pack reflecting a broad array of investments. Each one has broken key support lines and below the 150-SMA lines.
Is this breakdown really about “Greece or Growth (Lack of)?”
CLICK ON CHART TO ENLARGE
I am NOT INTO LABELS…. yet I was concerned that “DEFLATION/FALLING PRICES” was in store, across the board 90 days ago.
I mentioned that all of us can choose tools that….. look in a rear view mirror or attempt to look around the corner/what lies ahead for us. (See DEFLATION post here)
Fundamentally Fridays bottom line…..it appears we need to “get a grip that falling prices are taking place in a wide variety of assets!”
With the majority of assets falling in price…… “Capital Preservation” could be important!
I am not/patterns are not suggesting the sky is going to fall. In my opinion the key issue with 2008 was nothing more than did you own it! These patterns are suggesting the same thing again….should you or should you not own the majority of the assets in the 6-pack above?


Silver lining?
Does EPI look ready to breakout?
Aaron