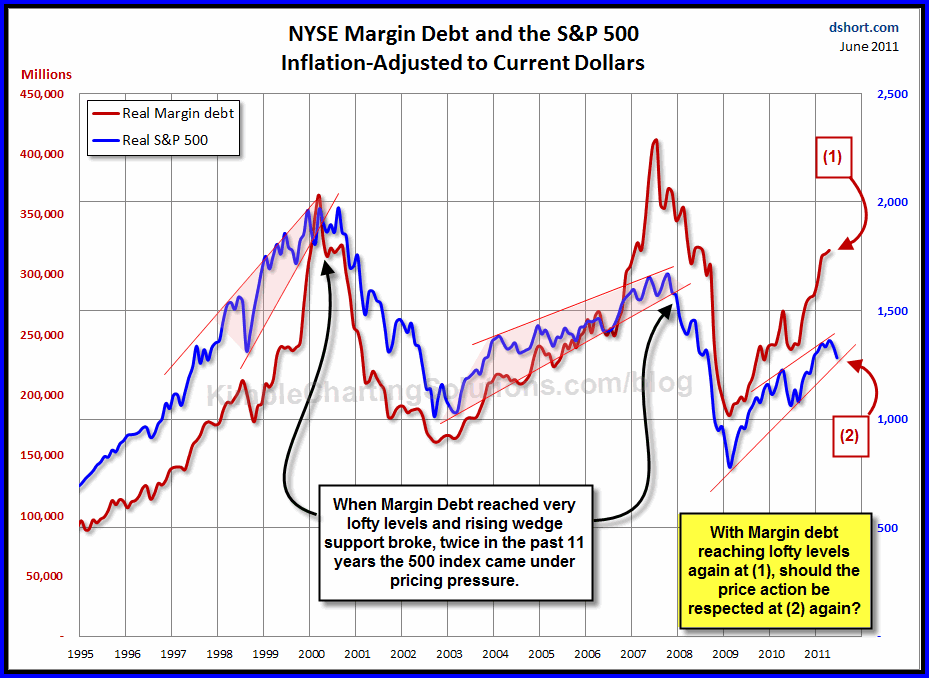
Below is another outstanding chart produced by Doug Short at dshort.com!
In the past when margin levels reached historically high levels, it was suggesting that the markets might be overvalued…..yet the unwinding of the debt really didn’t start happening until the support lines of the rising wedge patterns were broken to the downside!
CLICK ON CHART TO ENLARGE
If history is any guide over the past 16 years, when margin levels reached the 350-400,000 level, stocks were close to a peak in price, yet it took a support break in the 500 index, before the unwinding of the excess debt really started taking place.
With margin debt close to the 350-400,000 zone, the price action on support at (2), becomes extremely important, because odds are very high if support is taken out, a good deal of this margin debt will need to be sold!!!


