Rodney Dangerfield was a successful comedian, which used the tag line…..I GET NO RESPECT!
Even though the ”Power of the Pattern” is incorrect around a third of the time, I “FULLY RESPECT” that the other two-thirds of the time, it will be correct!
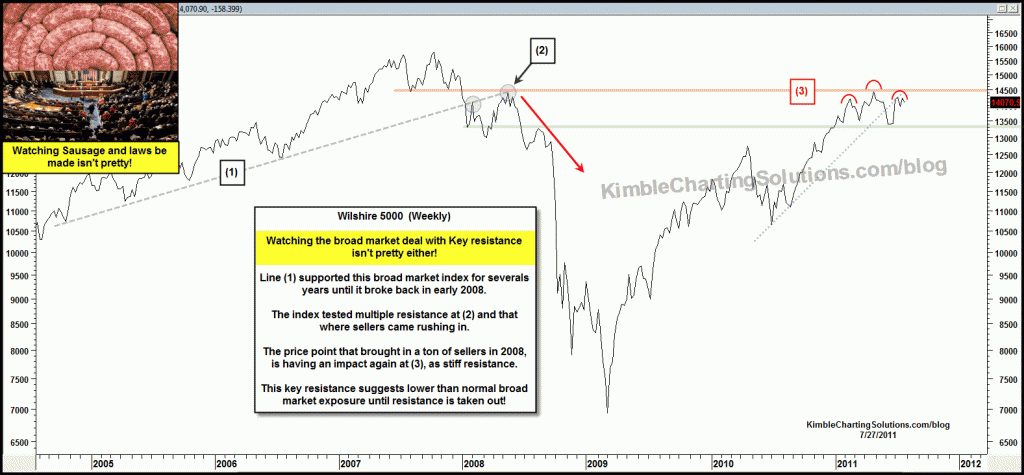
Below was a chart produced on 7/27, 8 business days ago, reflecting that an “UGLY and DANGEROUS” pattern was at hand in the Wilshire 5000 index. (see post here) The pattern was suggesting to “lower exposure to the stock market!”
What happened in the following 8 days since the post…. the Wilshire 5000 has declined over 17%.
When the “Power of the Pattern” is correct that a “Head & Shoulders” topping pattern is at hand, the declines throughtout history are usually large and swift!
Going forward Investors need to be aware, that once the neckline breaks, the declines are usually very large. The “H&S” pattern is one of the most bearish technical patterns that any asset can create…. The question now becomes….Is the 17% decline enough?
CLICK ON CHART TO ENLARGE
Last week I shared that I “hoped the declines had been enough” yet I suspected that due to the Long-term charts, the lows were not in place (see post here). The technical damage has been rather large in the past 8 days for sure.
Investors can expect a short-term bounce in here, since the VIX is so high…. yet from a longer-term perspective the lower end of the support zone and channel support dating back 70-years is still in play.


Chris – If you look at a weekly chart of the Wilsh 5000 going back to the mid 90s, do you see a large head and shoulder pattern setting up which could result in a very terrifying collapse in stock prices? If it played out of course.