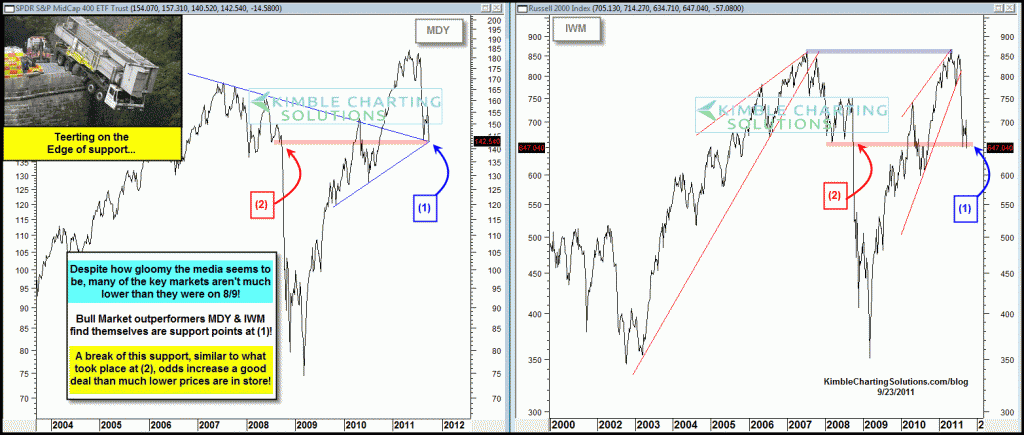
Last week I shared the chart below, reflecting the Bull market leaders, Mid-Cap 400 (MDY) and the Russell 2000 (IWM) were on key weekly support…Support is support until broken! (see post here)
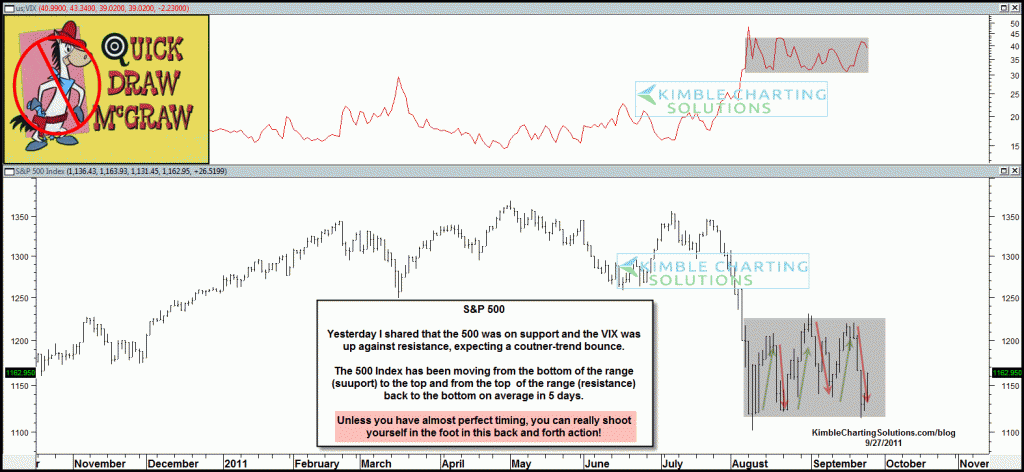
Mentioned yesterday morning due to the 500 on support and the VIX at resistance, a counter-trend rally was due. (see Macro/Micro post)
I have a quiz for you this morning…what is the total return of 5 days up, 4 down, 6 days up, 5 down, 5 days up and 4 down, during the last 6 weeks+? Answer…NOT MUCH!
CLICK ON CHART TO ENLARGE
The strategy I use is called TB&M (Tops, Bottoms & NO Middles) I attempt to find key exhaustion and reversal points. I am not a day trader! I believe the risk reward is more favorable finding something like the flag pattern in Silver (see post here) or shorting TLT up against a potential double top/Fib resistance level (see post here). Very early in the trade, yet so far today, TLT is down almost as much as the 500 index is up…so far ownership of TBT is acting ok.
This “Quick Draw McGraw” trading range will end soon and am really interested in the outcome! Now what do we do??? Unless you are a day trader and have perfect timing, doing nothing is getting you the same total return as being long from 8/5!


Equities in a Rectangle naffing about, breakout of the bottom and it was redistribution, breakout of the top it was accumulation