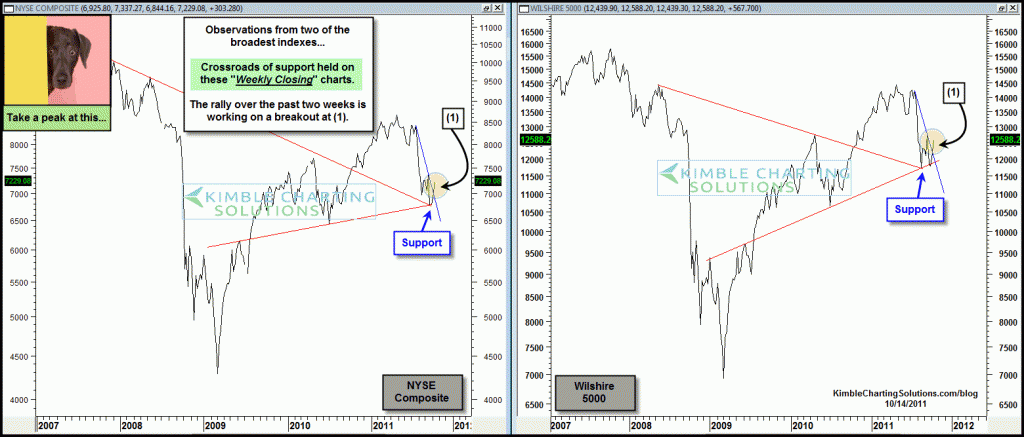
CLICK ON CHART TO ENLARGE
On August the 9th I ask…”Was a 17% decline in 8 days enough?” Reflecting that the Wilshire 5000 was now entering a support zone (see post here) This post discussed the effects of a “right shoulder breakdown” and that a bounce was due since the VIX was hitting very high levels.
Above is an update of two very broad indexes (NYSE Composite and the Wilshire 5000), reflecting that key support on a weekly basis held and the Wilshire 5000 is 900 points higher than the 8/9 posting.
Other broad market messages to take a peak at are… TLT breaks support after it created what looks like “Twin Peaks” (see post here) and the “Dollar Crushed” post reflected a weak Dollar after a large bearish wick was created last week (see post here)
We all know the world is not in perfect shape, yet despite the media pounding the table of how bad things are, key support did not break in these two broad market indexes!
Speaking of taking a peak…how about peaking at the news from this angle…about the time these key markets hit support, the 99%movement/protesters started gaining strength…Any chance this was a sign of a “Crowded Fear Trade” at hand?
Where was this movement at the “Head & Shoulders/Right Shoulder Top” in the Wilshire??? (see post here)


Hi Chris,
I only wanted to state that a breakout above 1230 (and subsequent hold at or above these levels) would mean that one should go long. 1220 is not the correct level to make this decision.
Charts suggest that we are against resistance in several areas (as you have already adequately demonstrated), and that we sure are ready for a pullback. It important to note that the late day rallies last Friday and this past thursday suggest that there is no momentum to retest the lows of the trading range.
At what point would you consider going long?
Thanks,
Aaron
I dropped by the protests myself just to support friends and observe. Of course there are plenty of smart minds there too. I was just speaking tongue in cheek and did not mean to overly generalize. Even the most pro business capitalist can denounce the issues of regulatory capture and corporate cronyism in our society and respect the principles of the demonstrators. But not all the protesters understand that’s what they’re demonstrating against. Anyway it’s a far bigger discussion than we have space for here.
Scott – too funny you think the protestors don’t have portfolio’s or understand biz…I happily protested in PDX and do have IRA’s, 401k’s, PM’s, etc. I work in the private sector and I wasn’t unusual in that crowd.
Scott….
My writing sucks, that is why I believe the charts should do the talking! My intent was to highlight that the VIX/fear index was reaching a high level for a month, which was also being reflected by people in the streets. When do people go to the streets, closer to key lows or highs?
In my 31 years I have never seen mobs before at highs, acting all pissed off…. How often do you hear…you dirty wall street, you made me too much money! … 😉
Why don’t people harvest at highs? 🙁
Society is very good at “Buying at highs and Selling at lows” Wall street needs to help people with an “inverse emotional ETF” to this problem!
Chris, don’t be silly, the protesters don’t have portfolios 🙂 or the first clue about business or finance. If they had skin in the game like us they wouldn’t be out there.
Yes, a short on silver is a must-have at this point, especially for those that hold long gold exposure. Considering how hard the dollar has been pounded this last days, you’d expect silver to rocket to new highs, it’s been acting like a cadaver instead…
Look out for the funeral…
Luke81…what you share makes sense. We have gotten really fortunate/lucky owning ZSL on the huge smack a few weeks ago, ZSL picked up over 80% in less than a week. Per the subject of shorting up against resistance, SLV is my favorite, with a stop above the 23% level.
For short-term traders only: isn’t it today a good day to short the heck out of the S&P?? With such a mighty resistence in place at 1220, you know that if that one gets taken out, you don’t stand a chance, cover and forget. If it DOES hold, on the other hand, it could mean a ton of quick money… What do YOU think??