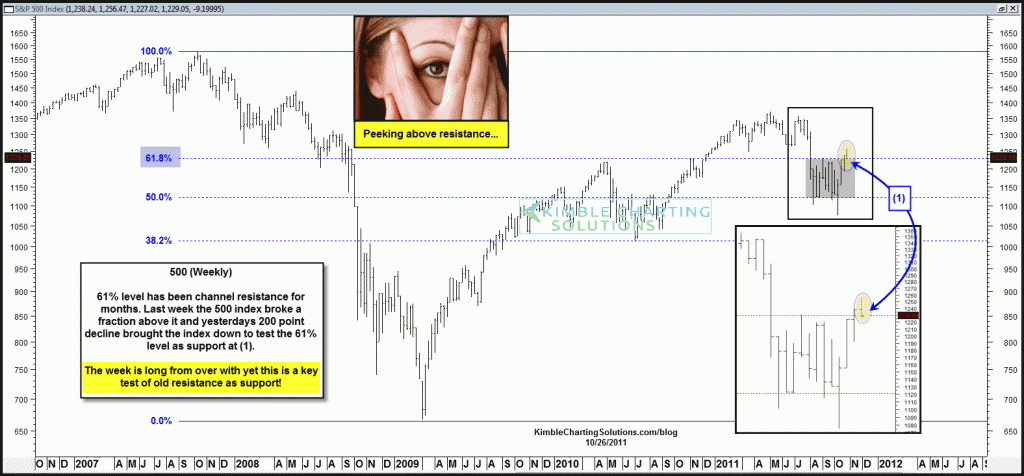
Shared the chart below on 10/26 (see post here), reflecting that the 500 index had broken above Fib resistance, after many attempts over a 60+ day time frame.
CLICK ON CHART TO ENLARGE
500 Index has moved around 3% higher, since the chart above. The chart below reflects that Fib. support and resistance remains key, inside of what looks like a flag/pennant pattern.
CLICK ON CHART TO ENLARGE
Personally I hope the flag/pennant pattern isn’t a correct read, due to if it is, we will get to put up with the media attempting to find something interesting to discuss during a boring market! If the read is correct, support and resistance will continue to narrow, yet this pattern is a long way from completion.
If this read is correct and support remains in place, owning vehicles with high dividend streams, such as high yield mutual funds or a PFF should serve investors well. (see PFF acting sweet)


