CLICK ON CHART TO ENLARGE
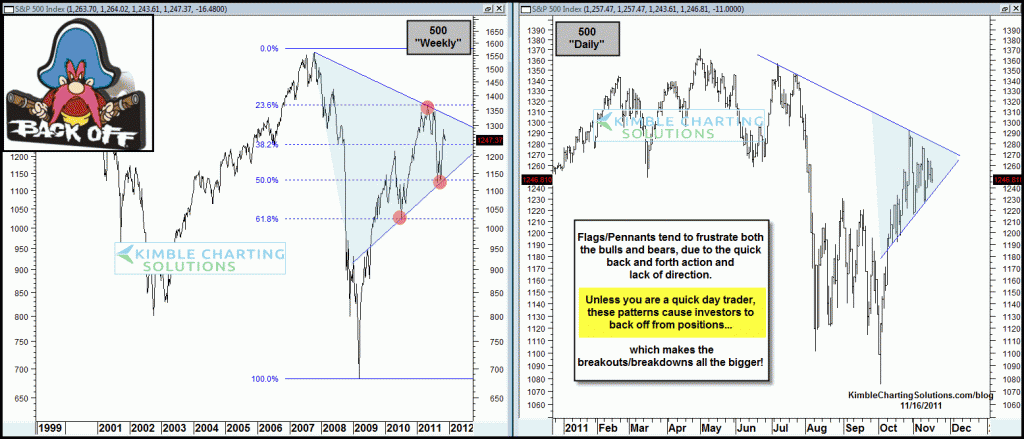
500 weekly (left chart) has created a series of higher lows at key Fib levels, a positive. At the same time this is happening flag/pennant patterns look to have formed on a weekly and daily basis. The back and forth action tends to frustrate bulls and bears, usually resulting in lower volume and sentiment studies that suggest lack of conviction in either direction at this time.
Very interesting and almost odd that the 500 index is close to the top of the flag and the U.S. Dollar is at key resistance as well! (see post here)


Aaron… Per you “close below the flag pattern” question. On a weekly basis, No. On a daily basis, right on the support line, what a shocker! 😉
We shorted the Russell at resistance, which was based soley on the Russell pattern.
Chris
Are my eyes deceiving me, or did the S & P close just below the flag pattern?
It looks to have closed below the 38% Fib line as well on the weekly chart
How common are false breakouts from these patterns?
If you are shorting the Russell, then I would expect a downside move and for TLT to breakout of its channel.
Where is the next support level? 1200? 50% Fib line?
Thanks,
Aaron
David….Fib is the same, log or linear.
Does your fib adjust for the log scale?
Maybe this friday, after options expiration, we get the move long awaited …