CLICK ON CHART TO ENLARGE
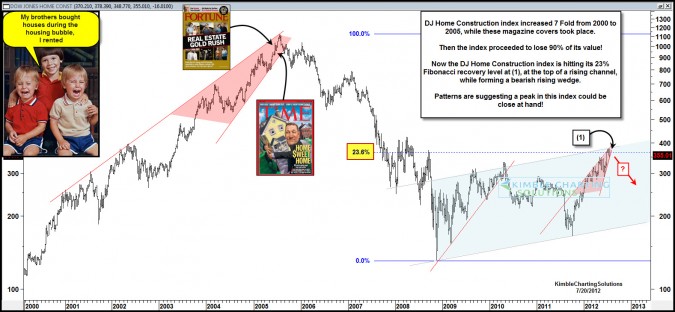
The Dow Jones Home Construction index rallied over 700% from 2000 to 2005, then it proceeded to lose 90% of its value in the following three years. This is a prime example of the effects of an Eiffel tower pattern. (see post here)
Since the 2008 lows, this index is now back at its 23% retracement level and created some patterns that suggest at least a pause is due in the index at (1) in the chart above.
CLICK ON CHART TO ENLARGE
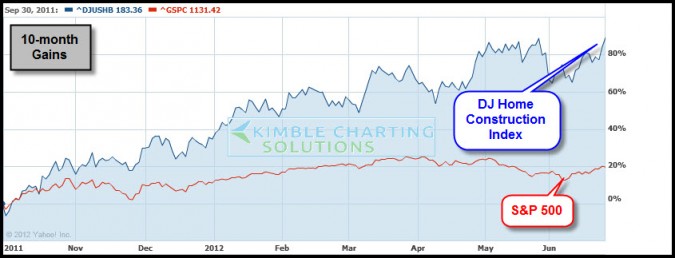
The DJ Home Construction index has reflected an enormous amount of relative strength compared to the S&P 500, gaining more than 80% in the past 10 months…
Is a pause in this index due? The Power of the Pattern suggests at least to harvest some gains here. Will see if “this time its different!”


