CLICK ON CHART TO ENLARGE
Once Apple broke below multi-year support line (1), it has struggled and looks to be forming a Descending Triangle (lower highs combined with a flat support line). The key to this pattern is support line (3), which has held a few times since November 2012.
With the potential Descending Triangle in place (most often a bearish pattern), a break of this support line would increase the odds of sellers stepping forward in this large and important company!
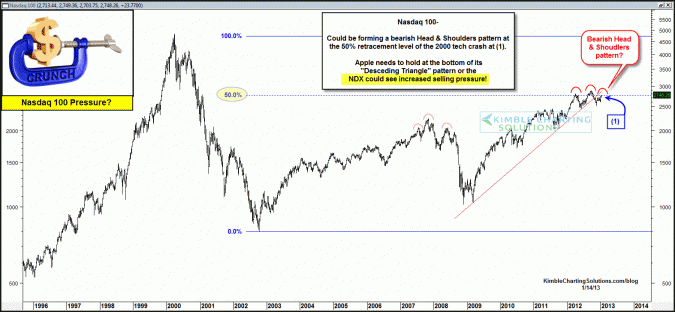
Nasdaq 100 finds itself at a key price level, the 50% retracement level of the 2000 tech bubble at (1) in the chart below.
CLICK ON CHART TO ENLARGE
Apple is a big percentage of the NDX 100, which could be forming the “Right Shoulder” of a Head & Shoulders pattern. The potential of this pattern (H&S), makes the support line of the descending triangle in Apple all the more important!
–


