One of the more popular discussions in the new year revolves around the efforts of Japan’s New prime minister (Shinzo Abe) to print money and drive down the Yen/ push up the Nikkei 225 index & risk assets in Japan. (see print money for the whole world)
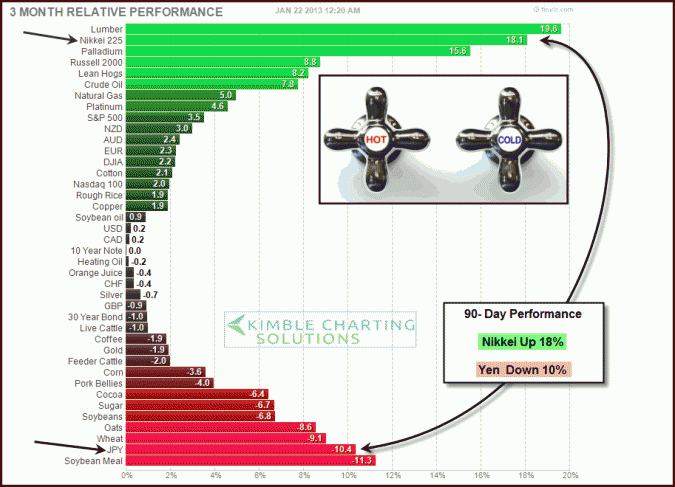
The table below reflects that PM Abe might be having some success over the past 90 days, as the Nikkei has rallied 18%, while the Yen has declined over 10%.
CLICK ON CHART TO ENLARGE
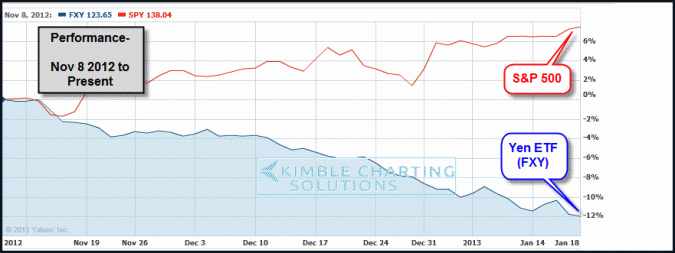
The table below reflects a similar situation is taking place between the Yen and the S&P 500 over the past few months, as they are heading in opposite directions.
CLICK ON CHART TO ENLARGE
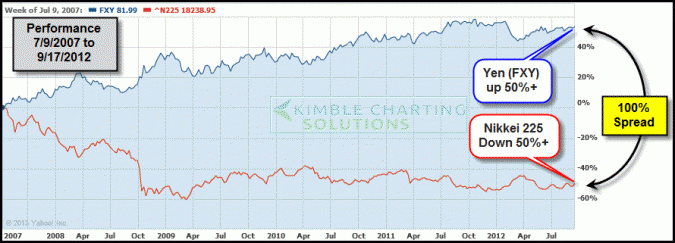
Is it common for the Yen and Stocks to move in opposite directions? The table below reflects a 100% spread between the performance of the Yen and Nikkei from 7/2007 to 9/2012.
CLICK ON CHART TO ENLARGE
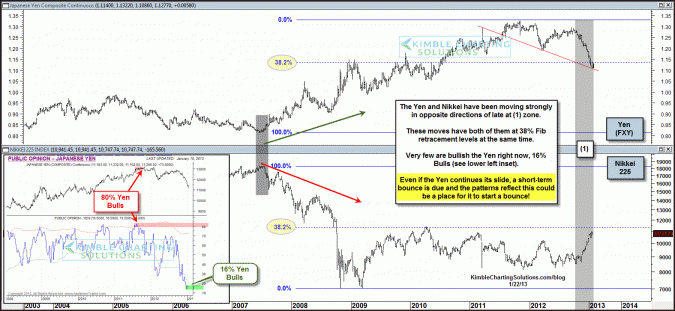
The charts below reflects that the decline in the Yen/rally in the Nikkei of late, have both of them at 38% Fibonacci retracement levels.
CLICK ON CHART TO ENLARGE
As the Yen is hitting its 38% Fibonacci level, bulls are very hard to find in the Yen right now, as bullish sentiment readings have dropped to just 16% bulls (see lower left inset chart).
A falling Yen has been good for the Nikkei 225, S&P 500 & 401k stock values over the past few months. Should the yen break below its 38% Fib level, the positive impact on risk assets would continue.
Do keep in mind that during bear markets/declines, rallies do take place. The patterns/sentiment reflect the Yen (FXY) could experience a rally, starting at any moment. How could investors benefit from this situation? Premium and Sector Members are looking to benefit from a rally in the Yen (FXY).


