CLICK ON CHART TO ENLARGE
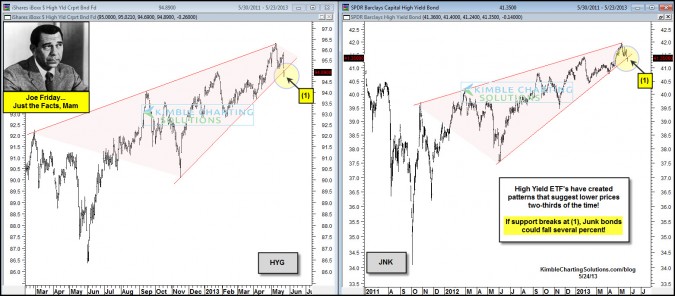
High Yield ETF’s JNK & HYG have formed bearish rising wedges, that suggest two-thirds of the time prices will end up lower in the future. Support line of the rising wedge is being tested very hard/starting to give way right now.
This pattern becomes very important with the Effective yield on high yields at the lowest levels in 20 years plus (most overvalued ever), reflected in the chart below!
CLICK ON CHART TO ENLARGE
Joe Friday…. Effective yield has formed a bullish falling wedge at (1). This pattern suggested higher yields two-thirds of the time.
If yields do move higher, the majority of the time stocks end up lower in price.
–


