CLICK ON CHART TO ENLARGE
The chart below reflects that steel related investments have performed poorly over the past three years, when compared to the S&P 500. As you can see the Steel ETF is lagging the S&P by almost 80% over the past three years.
Is an opportunity at hand?
CLICK ON CHART TO ENLARGE
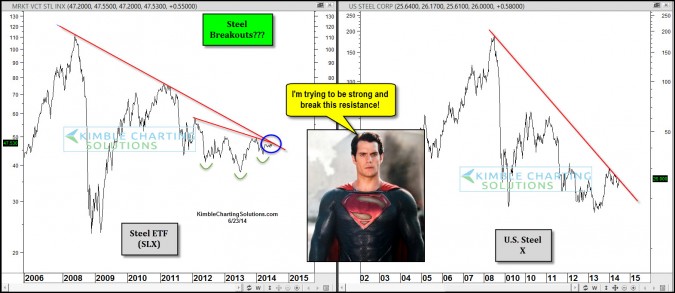
The top chart reflects that the steel ETF (SLX) and U.S. Steel (X) could be breaking out from steep falling resistance if they would happen to rally a little more. SLX may have created a bullish inverse head & shoulders and could be about to break the neckline.
Will “Steel man up and break resistance? Stay tuned, a breakout could be bullish after doing so poorly for the past three years!
–
–


