
CLICK ON CHART TO ENLARGE
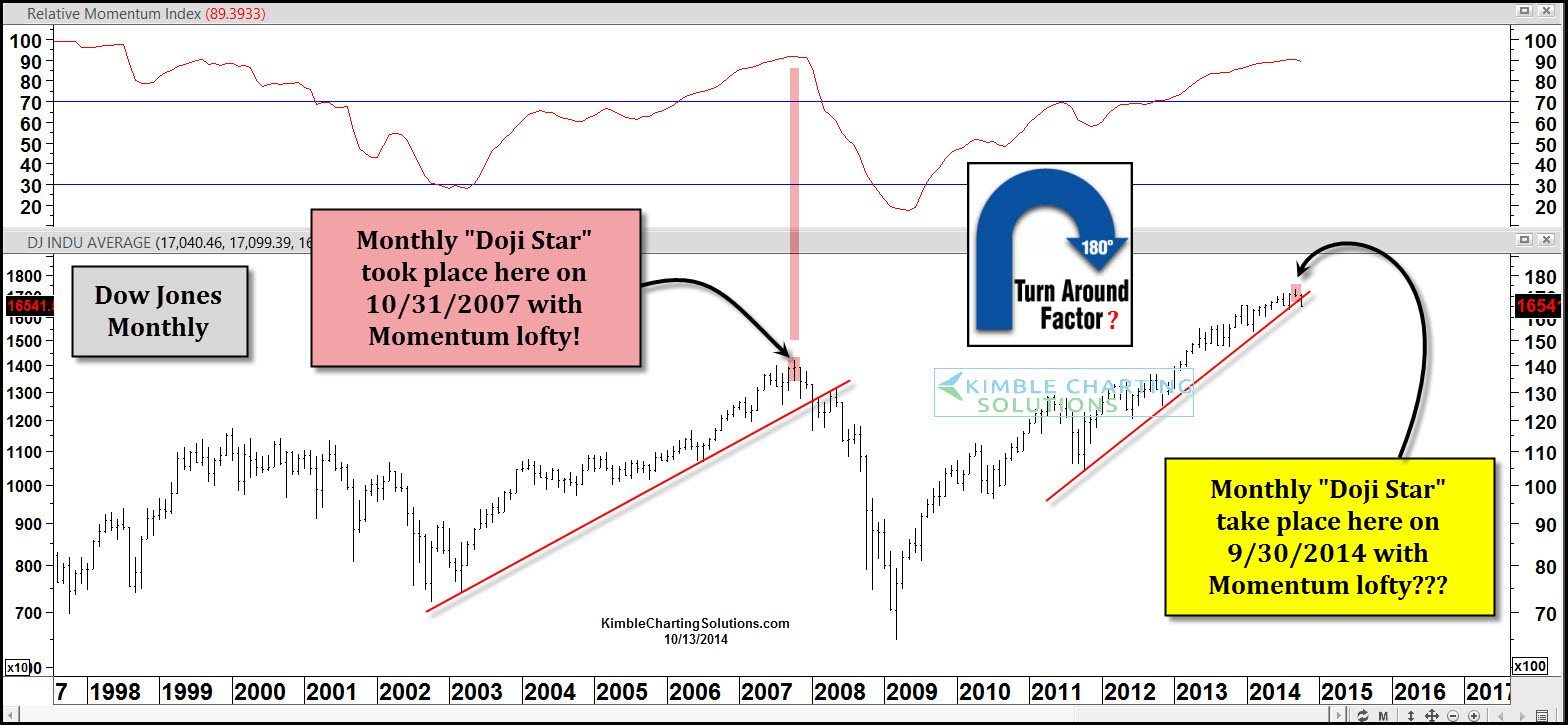
Did the Dow Jones Industrial index create a “Doji Star” topping pattern last month? Possible!
Doji Star patterns (which look like a + sign on a chart) can take place at key reversal points/highs & lows.
The above chart highlights that a Monthly Doji Star took place in Oct of 2007, which ended up marking the high that year.
Did the Dow create a “Monthly Doji Star” topping pattern took place last month? It will take some time to prove this pattern out, since this is a monthly chart. If this pattern read is correct, it could become a very important high in the market!
-
