
CLICK ON CHART TO ENLARGE
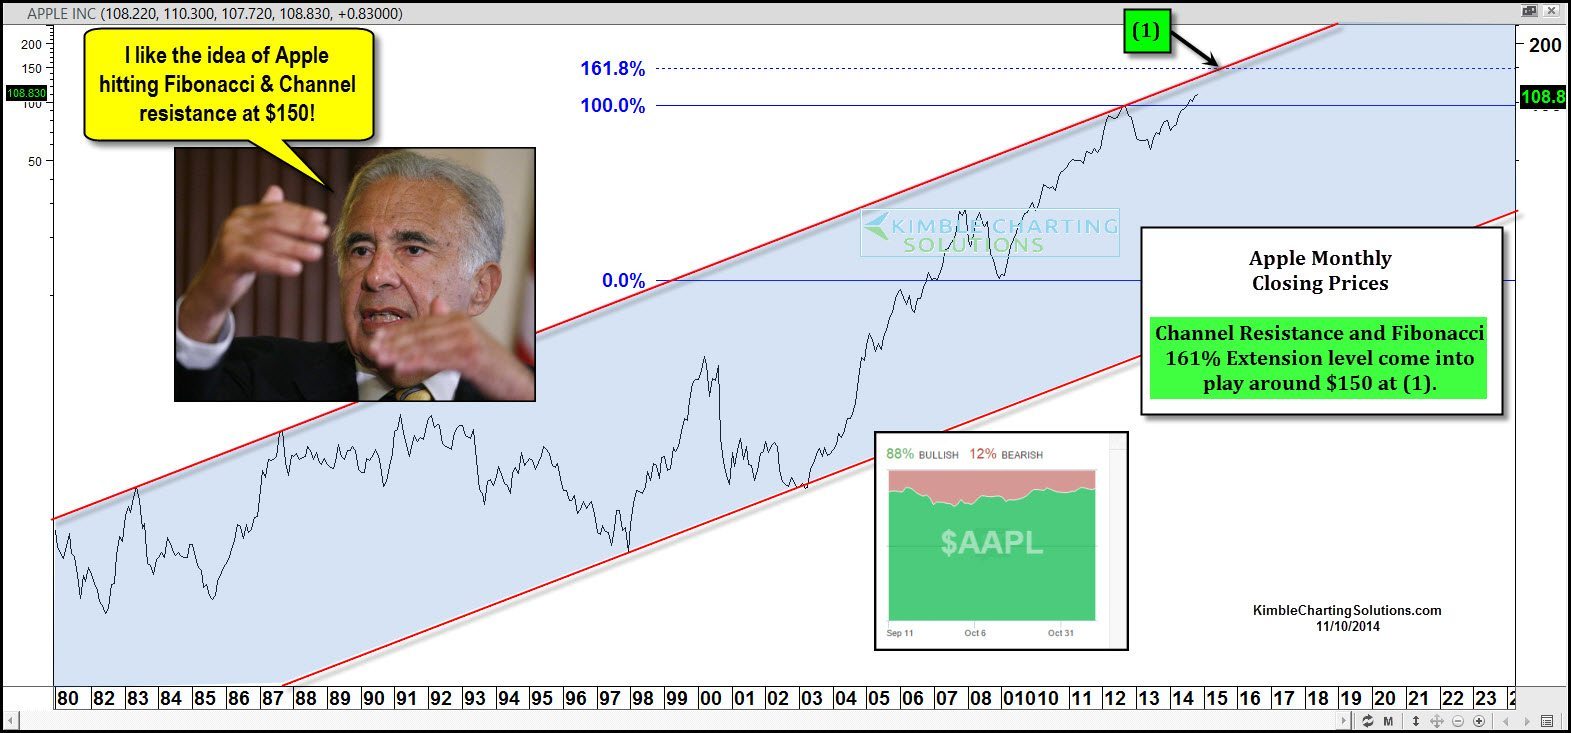
Apple has remained inside of a long-term rising channel for the past couple of decades, with the top of this channel last coming into play at the 2012 highs.
Two key highs and lows over the past 10-years took place in 2006 (Low at $12) and in 2012 ($95 high).
Could this long-term channel and Fibonacci extension levels come into play in Apple’s future? Both meet at (1) in the chart above around the $150 level.
If Apple hits this level, I suspect Carl Icahn and a few investors will be happy campers!
–
Check out our new website…..Here
–
