
CLICK ON CHART TO ENLARGE
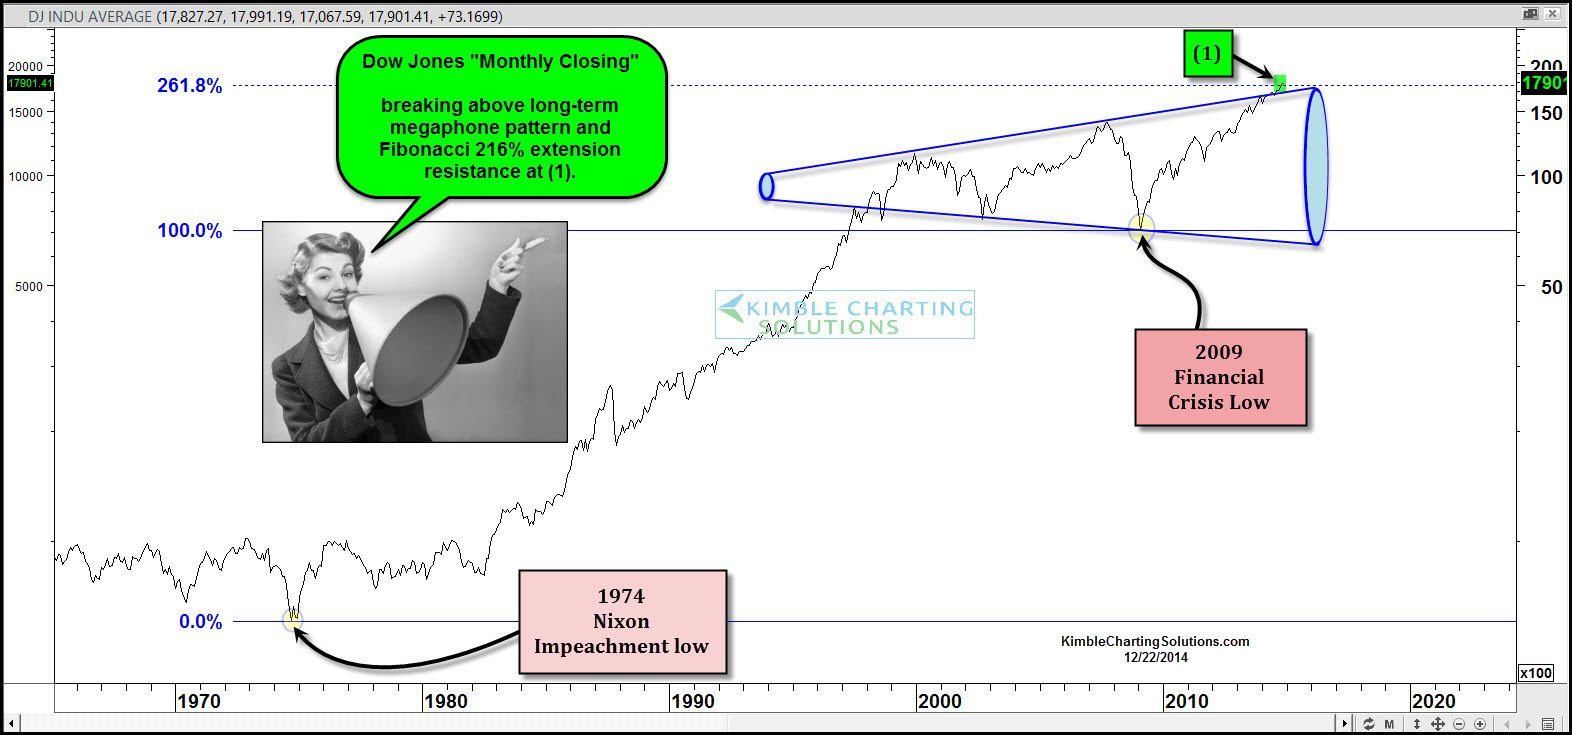
As the year is coming to an end and the Dow is near all-time high levels, I wanted to take a peak at two different long-term perspectives. One of them Fibonacci Extension levels and the other a long-term Mega phone pattern.
If one applies Fibonacci to the lowest “monthly closing prices” during the Nixon impeachment and the 2009 financial crisis, the 261% Fibonacci extension level has come into play of late at the 17,600 zone. The Dow is attempting to break above this level at (1) above.
The Dow is working on breaking above the top of this long-term megaphone pattern at the same time. A break above both levels by the Dow should be considered a positive sign.
In October, the Dow created the “largest bullish monthly wick” since the 2009 lows. This month the Dow is attempting to create another large bullish wick, near these key levels. We will see on 12/31/14, if this large bullish wick is still in play, two months after the huge bullish wick in October!
These bullish wicks and positive messages from our Shoe Box, High Yields and Advance/Decline line indicators are suggesting that our Slow Money/Global Dashaboards Customers remain majority exposed to stocks in the U.S.
If the Dow would reverse course here and our tools send a concerning message, we would reduce exposure ASAP!
–
–
See more of our research at Kimble Charting Solutions
–
