
CLICK ON CHART TO ENLARGE
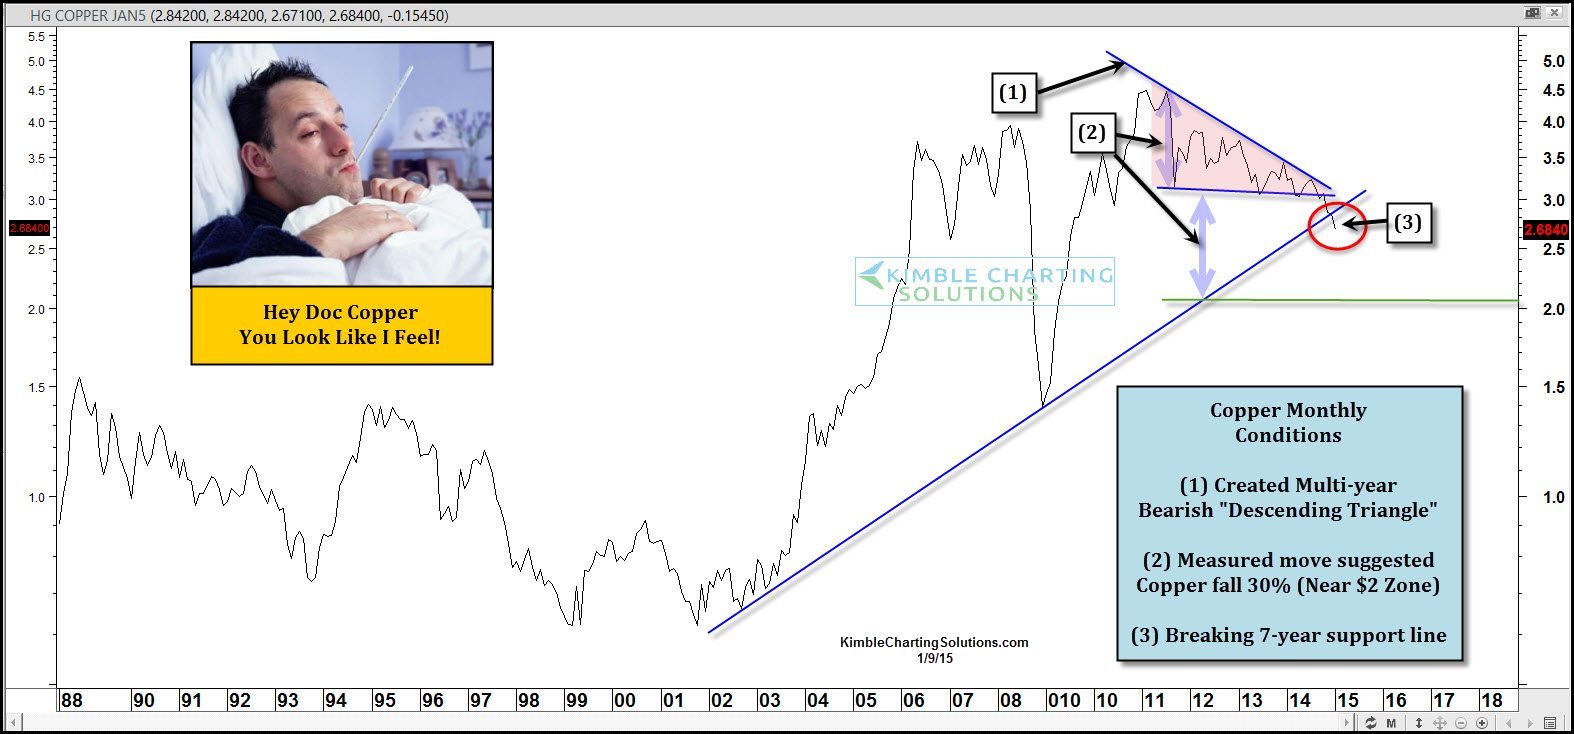
In the Copper market, billions of free thinking people/investors look to have formed a bearish descending triangle over the past few years at (1). A little over half the time this pattern results in lower prices. When the bearish slant support breaks, over 80% of the time lower targets are hit, according to Forex Tribe.
Two years ago the Power of the Pattern suggested Silver should decline 50% in value. Why was this suggestion made? Billions of free thinking people at the time had created a bearish descending pattern in Silver, when the base was near the $30 level. At the time many questioned this call, since Silver had already declined 40% over the prior couple of years. Of late, Silver reached the downside target which was the $15 zone.
Measured move projections are based upon the height of the descending triangle. With that in mind the current pattern in Copper is suggesting Copper should fall near the $2, which is around 25% below current prices.
The odds of this move taking place would appear to have increased of late, as Copper looks to be breaking fairly long-term rising support at (3).
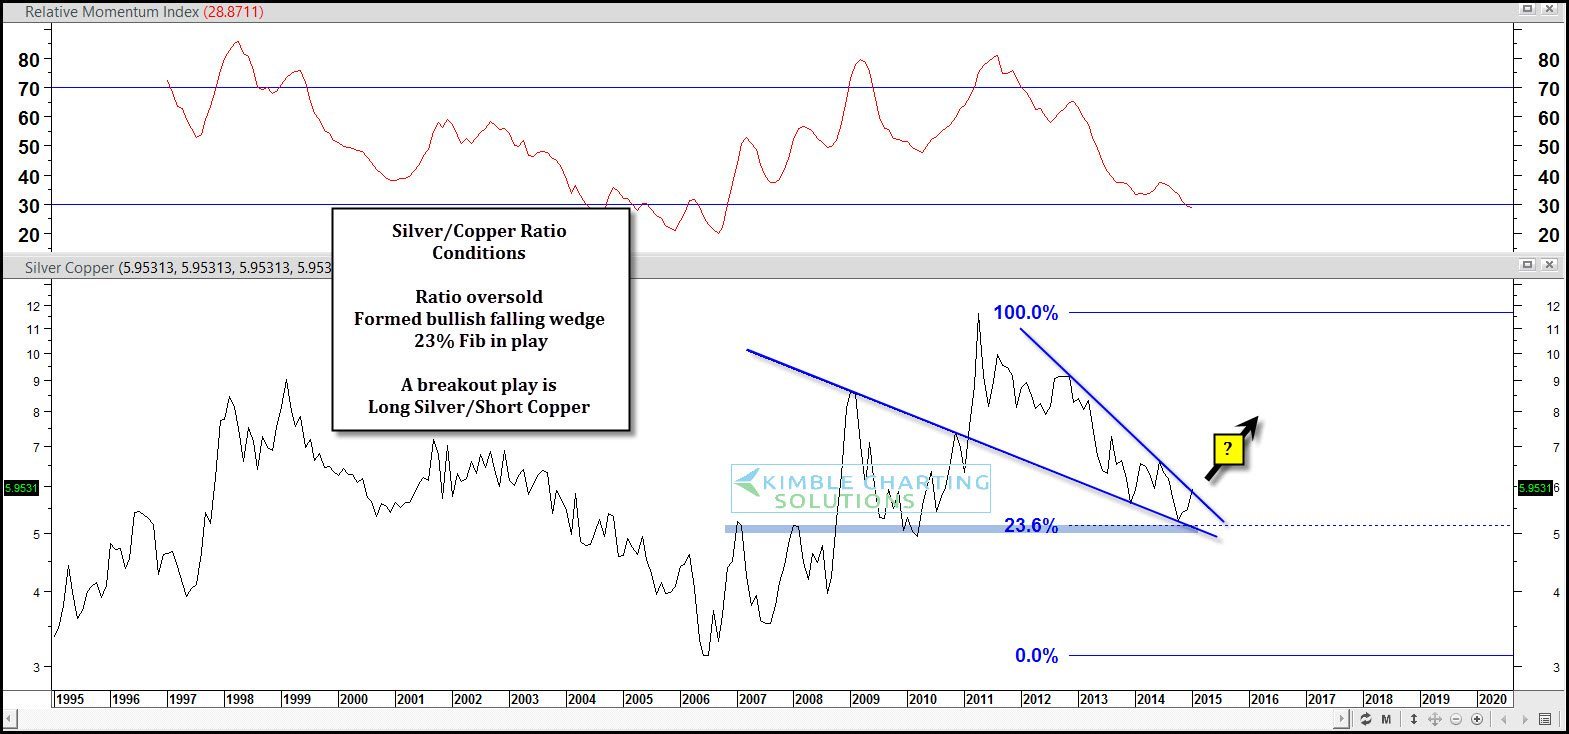
Speaking of Copper & Silver, take a look at the Copper/Silver ratio below, that I shared chart with members of late.
CLICK ON CHART TO ENLARGE
The ratio recently hit its 23% Fibonacci support level, it appears to have created a bullish falling wedge (two-thirds of the time results in higher prices) with momentum oversold. A breakout from the bullish falling wedge would suggest to Long Silver & Short Copper.
If you like being aware of these patterns, I would be honored and humbled to have you as a Premium or Triple Play member.
–
–
See More of our Research….HERE
