
CLICK ON CHART TO ENLARGE
When it comes to ”Red Hot” stock markets around the world, the overwhelming winner the past 90-days is the Shanghai index, up more than 40%. Even though the S&P 500 is doing well and is just under 3% away from all-time highs, its performance compared to the Shanghai index over the past 90-days is pretty cool, as it under performed by -37%. (see chart below)
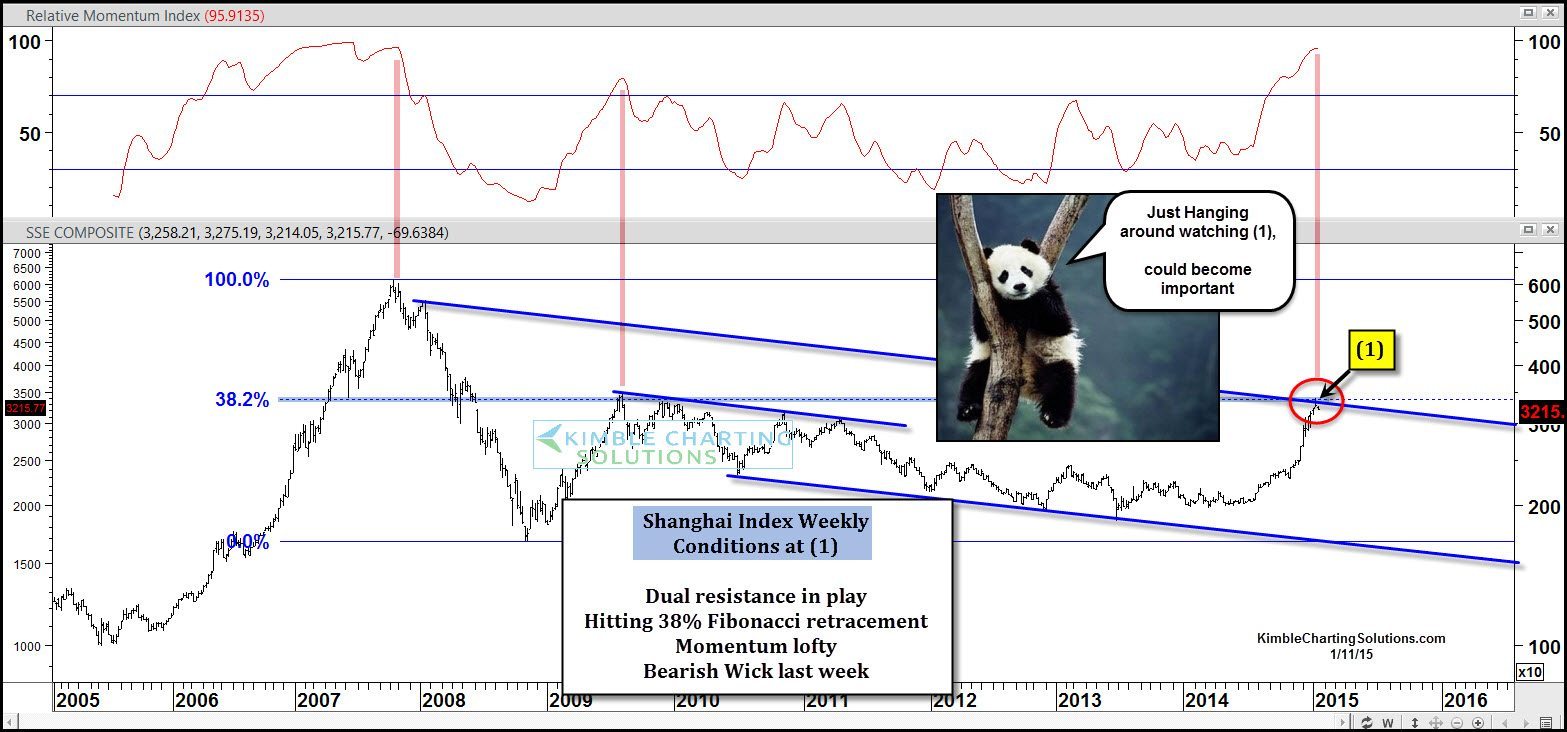
The red hot performance has now created the following conditions in the chart above…The index is now touching the top of multi-year falling channel, at its 38% Fibonacci retracement level based upon the 2007 highs/2008 lows and it created a bearish wick last week at (1) with momentum at the highest level since 2007.

CLICK ON CHART TO ENLARGE
One thing is perfectly clear at this time, the trend is “UP” in the Shanghai index. (Above support and all key long-term moving averages).
I attempt to find prices zones where reversals “can” take place (See TB&M Strategy). Time will tell if this will become an important inflection zone for the worlds hottest stock market.
–
–
See more of our research….HERE
–
