
 CLICK ON CHART TO ENLARGE
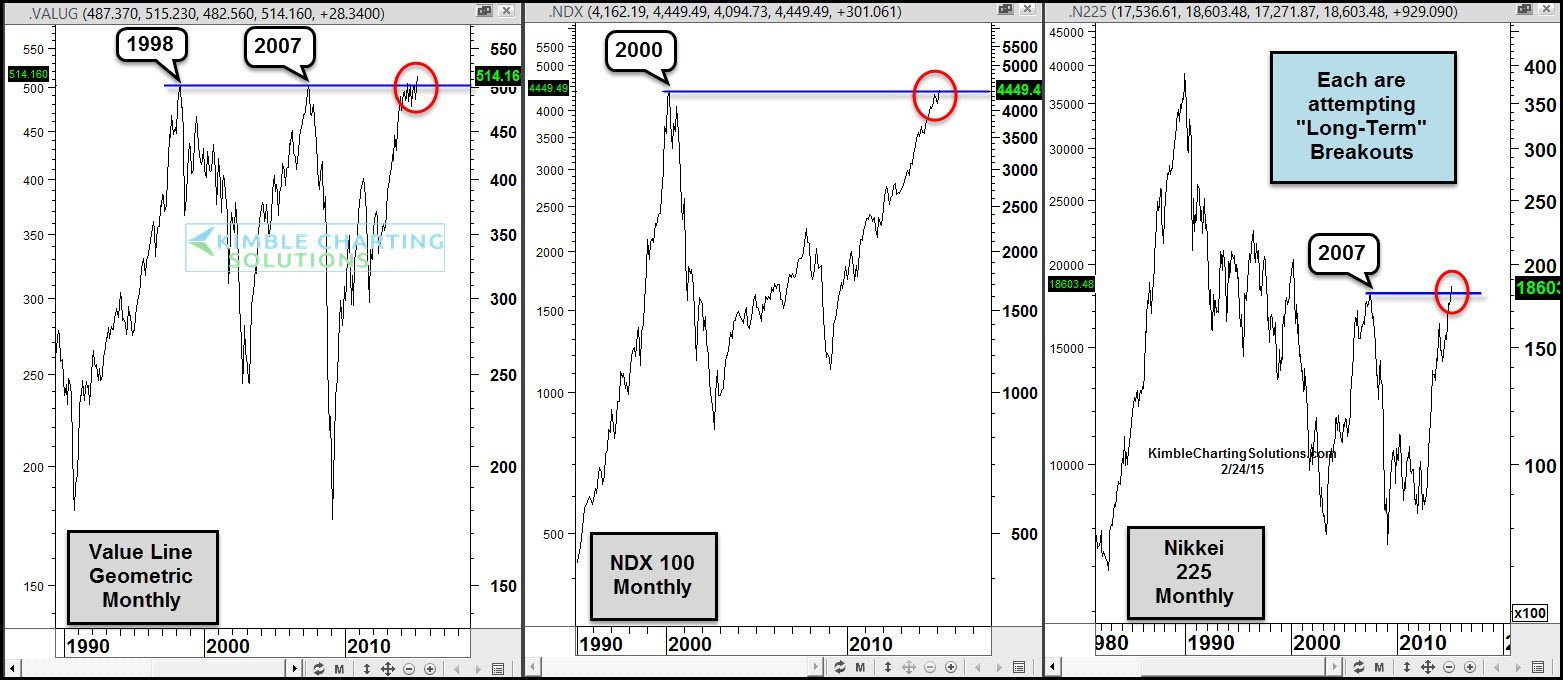
The above 3-pack looks at the Value Line Geometric, Nasdaq 100 and Nikkei 225 since 1990, on a “Monthly Closing” basis.
As you can see the Value Line is attempting to make a triple top breakout, the Nikkei is attempting to break about its 2007 highs and the NDX 100 is staring its March 31, 2000 closing highs.

Since these are monthly charts, breakouts are not so called “official breakouts” until the end of the month. Should these index’s succeed in jumping over these long-term resistance lines, it would be considered a bullish event.
If you like long-term Power of the Pattern perspectives, you might like our weekly “Global Dashboards” service… Details below

–
