
 CLICK ON CHART TO ENLARGE
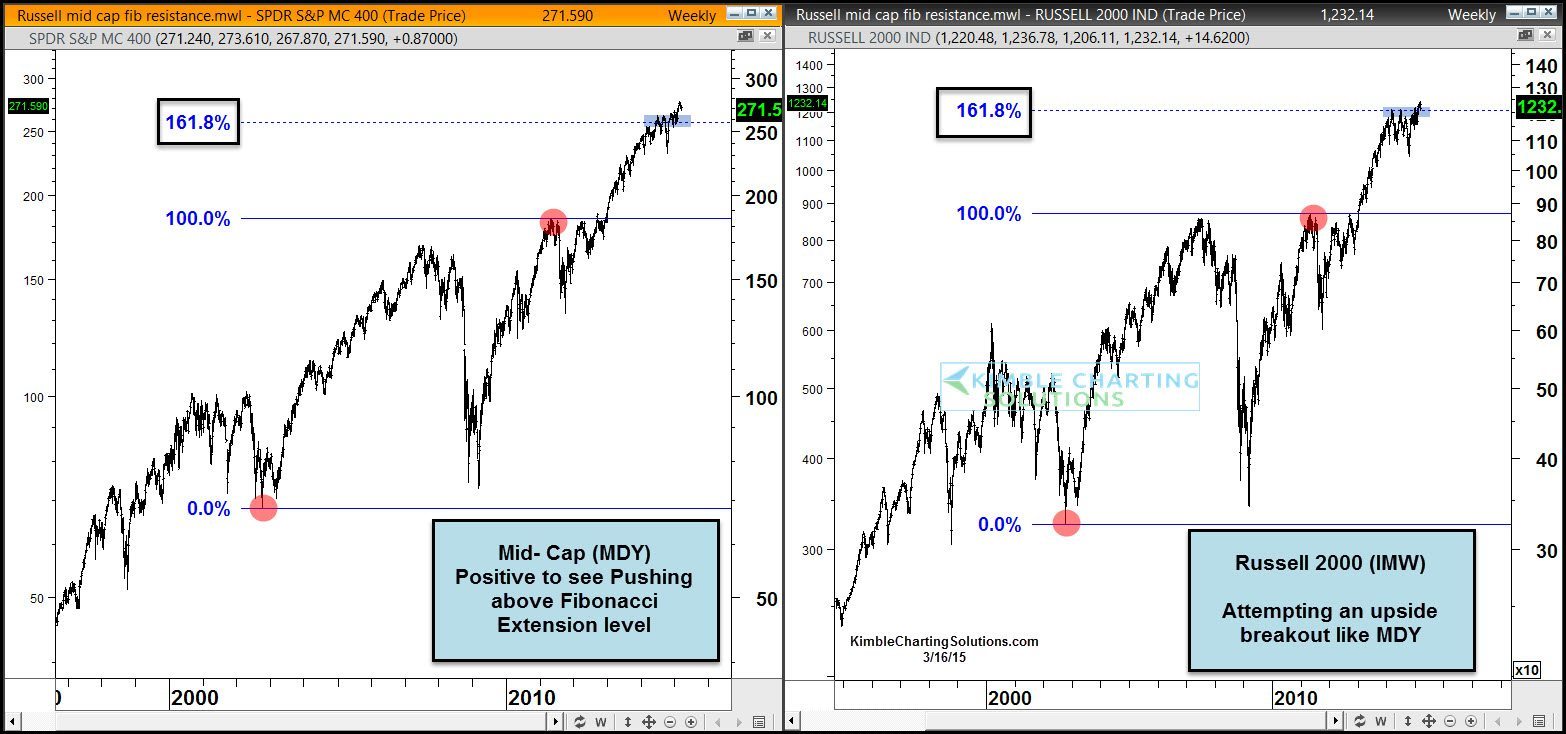
I applied Fibonacci extension levels to the 2002 lows and 2011 highs in Mid Caps. The 161% Fibonacci extension level looked to create some resistance, as Mid Caps chopped around this level for 5-months last year. Mid-Caps finally broke above this level and are pushing higher.
I applied Fibonacci to the same price points in Small Caps (Russell 2000). As you can see the Russell is attempting to push above the same 161% extension level.
 CLICK ON CHART TO ENLARGE
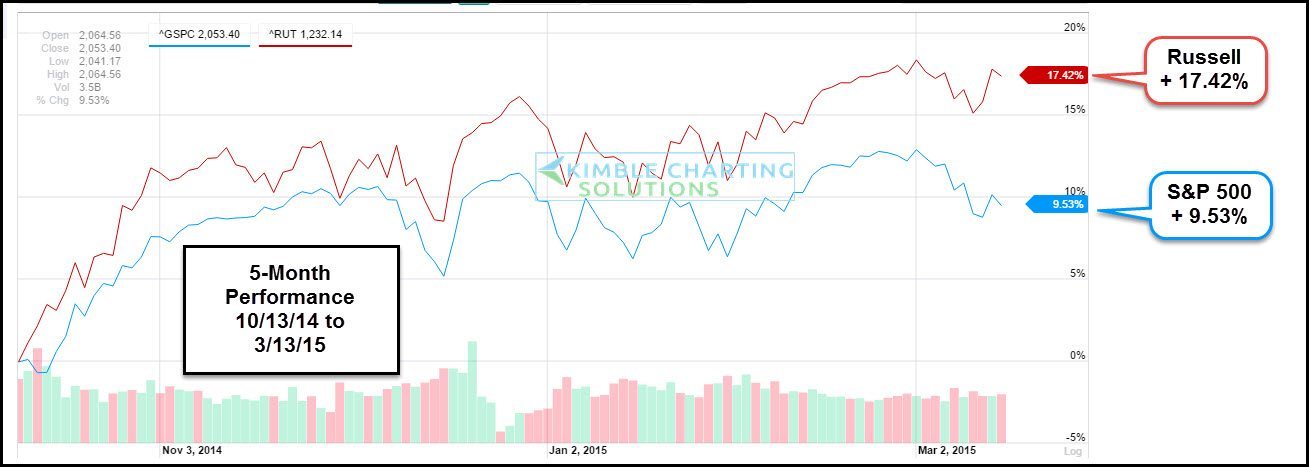
Small Caps have been much stronger than large caps the past 5-months. Should small caps push above the 161% Fib extension level, this out performance could well continue. Seeing Mid and Small Caps out performing large caps has historically been an ok sign for stock indices in general.
–
