
 CLICK ON CHART TO ENLARGE
Apple closed last week at an all-time weekly closing high at (1) in the chart above. Apple recently broke above its 4-year rising channel, came back to test old resistance and pushed higher, setting this new record high.
In November of last year, when Apple was trading below $110 per share, the Power of the Pattern shared that Apple’s upside target stood at $150. (See post here)
Below is a long-term update on Apple
 CLICK ON CHART TO ENLARGE
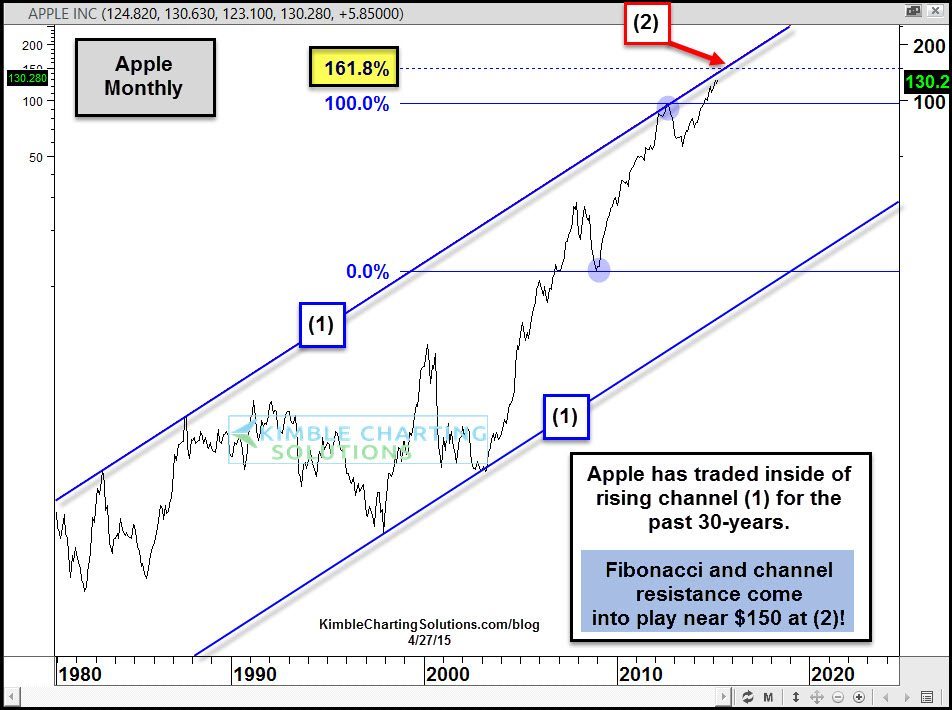
Apple has remained inside of rising channel (1) for the past 30-years. I applied Fibonacci to the 2008 lows and 2012 highs and the first Fibonacci extension level comes into play at $150, which also happens to be the top of rising channel (1).
On a percentage basis, dual resistance that the Power of the Pattern feels should be respected, comes into play around 15% above current levels.
To receive our research on a Daily or Weekly Basis… 
