
CLICK ON CHART TO ENLARGE
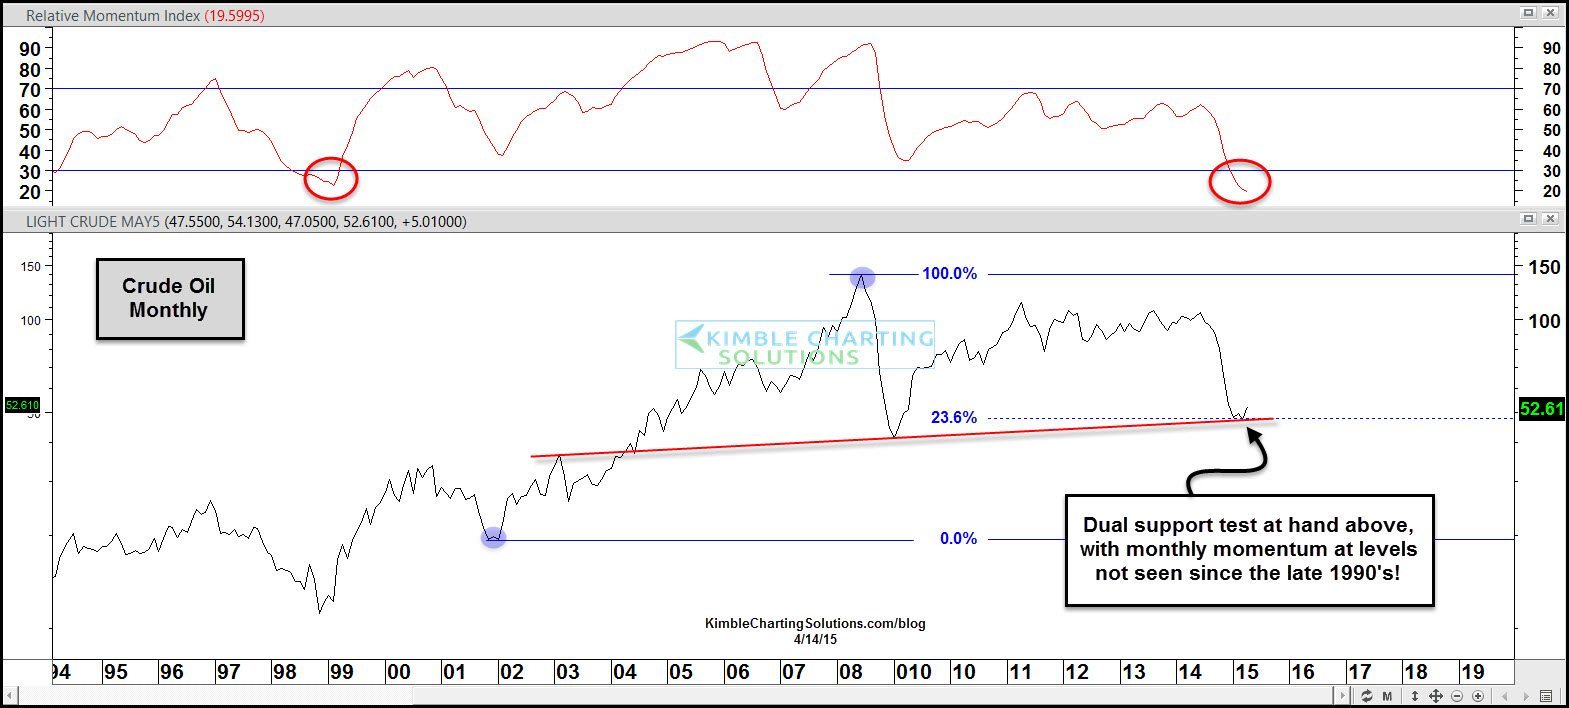
This chart looks at Crude Oil over the past couple of decades, on a monthly basis.
Crude Oils large decline over the past 8 months took it down to its Fibonacce 23% retracement level and a support line at the same time. The large decline has driven monthly momentum down to levels not seen since the late 1990’s.

CLICK ON CHART TO ENLARGE
This chart compares the S&P 500 to Energy ETF (XLE). When the ratio is heading higher, the S&P 500 is reflecting strength over XLE. As you can see the ratio has just experienced one of its sharpest 9 month rallies in the past 20-years. This rally drove the ratio to the top of a rising channel and momentum reached the highest levels ever recently.
Now the ratio and momentum could be breaking support. If this is a new trend by the ratio, being long XLE and Short the S&P could pay off, just as the opposite trade has paid off for the past nine months!
–
