

Just the facts….Commodities have had a rough few years!
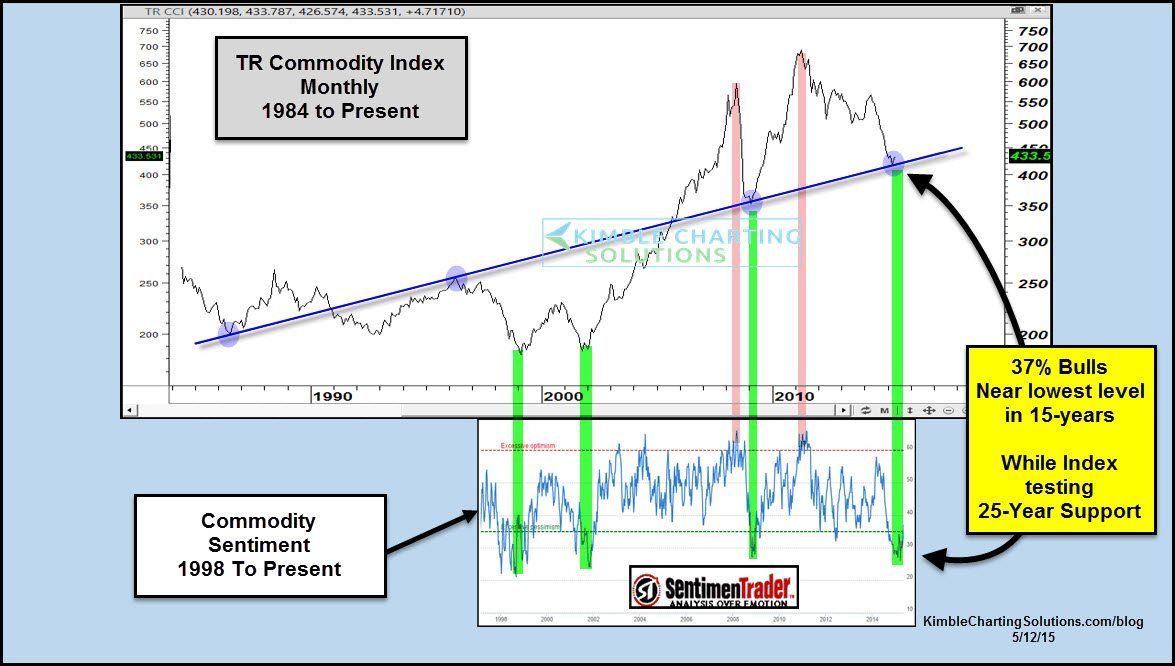
Below takes a look a the Thompson Reuters Commodities index from 1984 to current, with Commodity Sentiment from Sentiment Trader.com applied.
 CLICK ON CHART TO ENLARGE
The decline over the past 4-years has taken this commodity index down to a support line that has been influential to this index for the past 25 years.
This long-term line now represents a key long-term test of support.
As the same time support is being test, Commodity bulls are hard to find. At this time 37% of investors are bullish commodities, which is near the lower end of levels over the past 15 years.
What assets could benefit if this support line holds?
 CLICK ON CHART TO ENLARGE
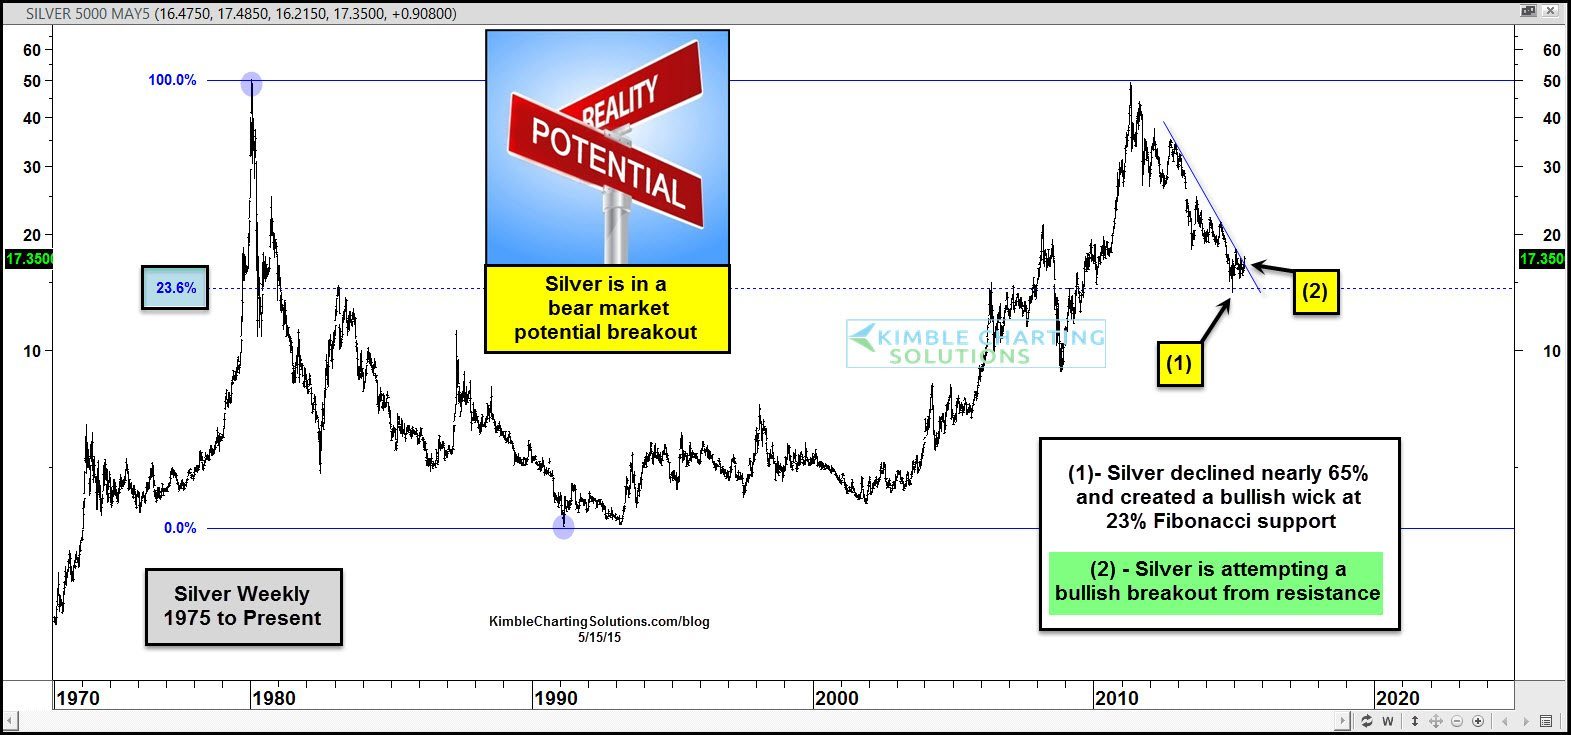
This chart reflects the Silver has tanked over the past 4-years, falling 65% at one point in the past year. Silver hit a long-term fibonacci support level at (1) above and created a bullish reversal pattern at this key Fib line. Now Silver is making an attempt to break above three year falling resistance at (2).
This is a huge test for Silver, as its failed to breakout the past few times its hit this resistance line!
Joe Friday… For the commodity space, this is one of the most important tests of support in the past few decades. Should commodities rally off this support line, it would surprise the majority of investors!
–
