
 CLICK ON CHART TO ENLARGE
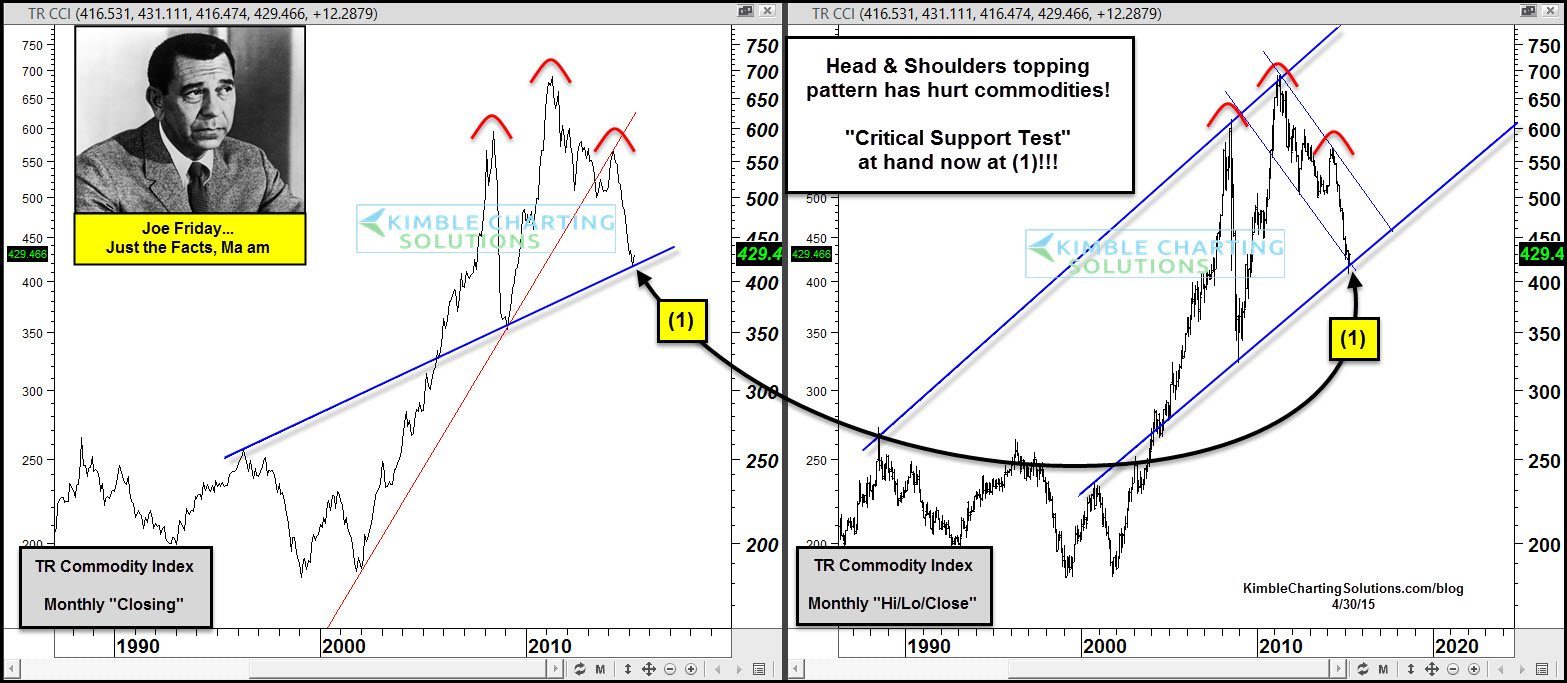
Commodities have had a rough go of it the past 4-years, declining almost 40%. The above charts look at the Thompson Reuters Commodity Index since the 1980’s.
The left chart is based upon “monthly closing prices,” reflecting that a neckline support test is at hand at (1).
The right chart is the same chart, based upon Hi/Lo/Closing prices. A dual test of support is in play at (1) in this chart.
Both charts reflect that long-term tests of support are in play and support is support until broken. Often support like this is a place where at least a counter trend rally takes place.
US Dollar weakness and Commodity strength might surprise a few and could be a sign of some macro global strength could be at hand.
Joe Friday just the facts…. Commodities are testing strong support lines. What they do going forward could tell us a good deal about global growth or lack of going forward. A break of this support could signal growth concerns.
Bottom line-A rare an important price point for commodities is in play right now!
Sign up for Power of the Pattern research can be found below… 
