

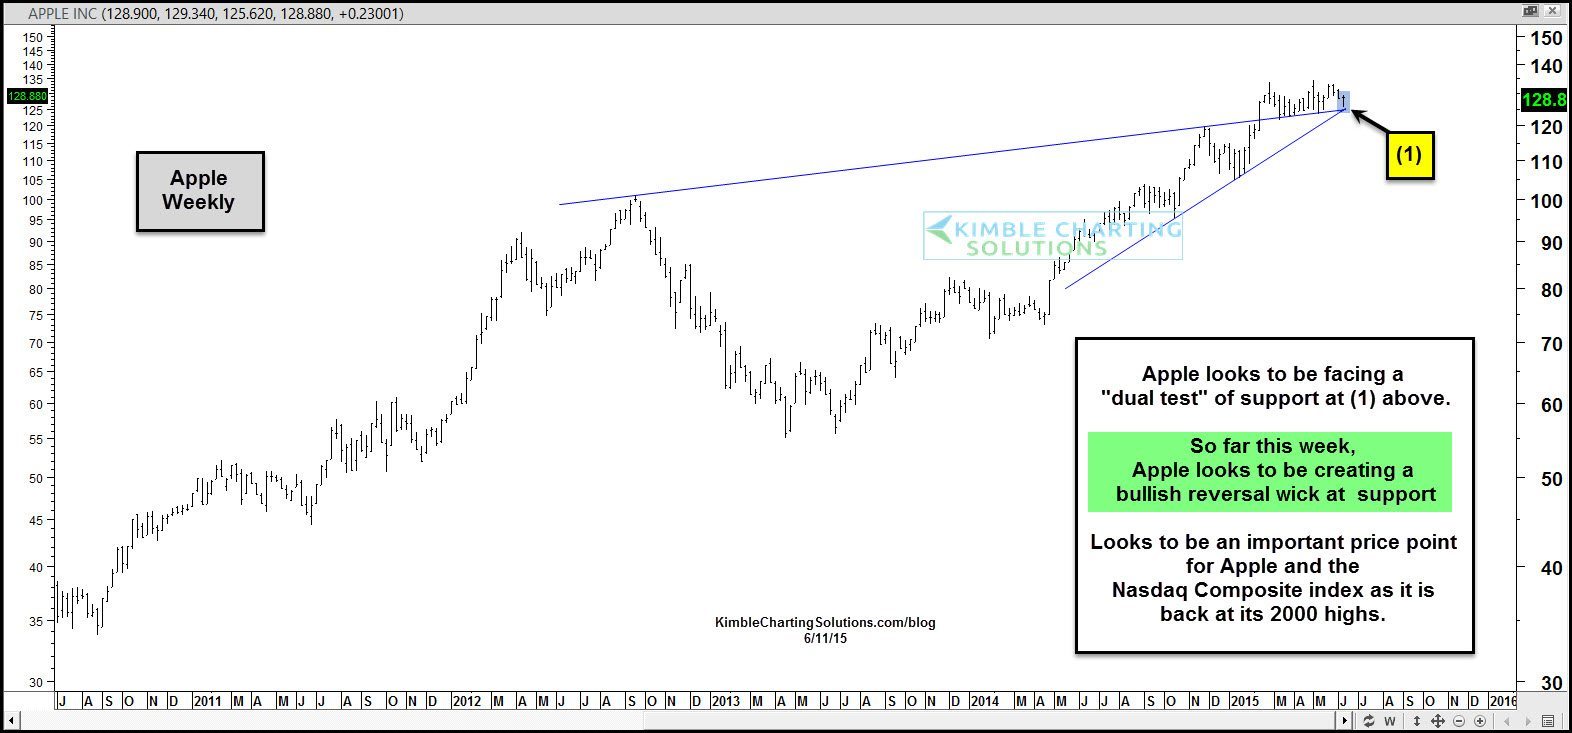
The chart below takes a look at Apple, as it could be creating a bullish reversal pattern (wick) at dual support. If this is true and should it push higher, it could help the Nasdaq Composite index avoid a double top pattern.
 CLICK ON CHART TO ENLARGE
Apple looks to be testing dual support at (1) above. The week is not complete, so far though, Apple looks to be creating a bullish wick (reversal pattern) at dual support.
The Power of the Pattern shared months ago (when it was trading at $108) that Apple could push up to the $150 level, where it would then face dual long term resistance levels. (see $150 post here)
Could what Apple does here become very important to the Nasdaq Composite index?
 CLICK ON CHART TO ENLARGE
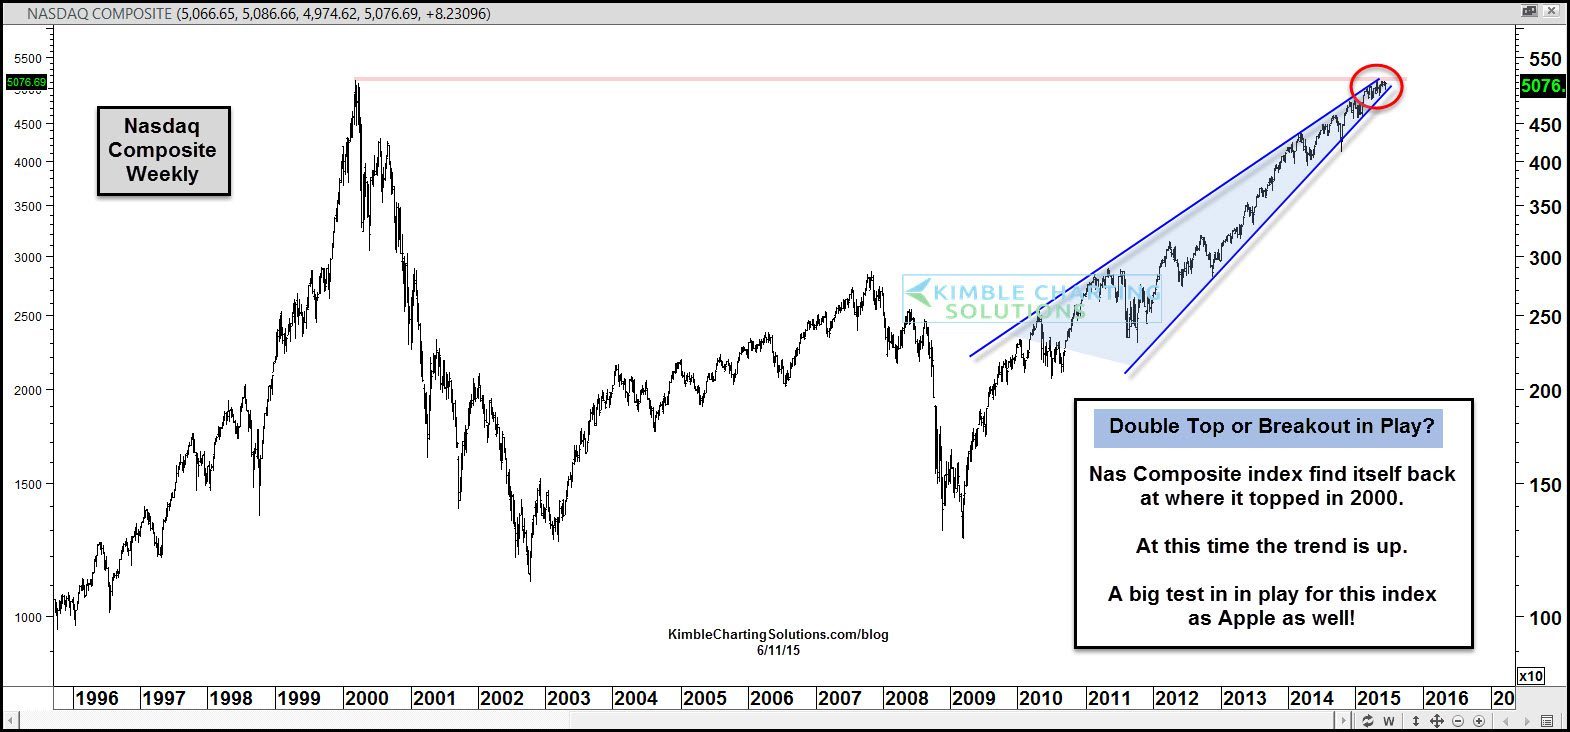
This chart reflects that the Nasdaq Composite Index is back at its 2000 highs, at the top of a rising wedge pattern. Is a “Double Top” in the making or a big time breakout in the cards?
What Apple does at this dual support test, could have a big influence over this important price point for tech stocks.
–
