

CLICK ON CHART TO ENLARGE
Did investors get ahead of themselves the past couple of days? From a fear perspective, it looks like they might have!
This chart looks at the Fear Index (VIX) over the past 25-years. As you can see, the VIX has only reached the 48 level, 8 different times in the past quarter century.
Two of the times the VIX hit the 48 level, the S&P 500 had declined 50% and was near the lows of a bear market.
In the last couple of days, the fear index spiked up and hit 50 yesterday as the S&P was nearing an 11% decline.
When looking at 2003 and 2009, the S&P fell 50% and the VIX hit 50 and this time it only fell 11% for fear to hit this lofty extreme. That is a 75% smaller decline to push fear to extremes.
The last time the VIX hit the 48 level was in 2011, when the S&P 500 was declining around 20%. It took almost twice the decline in 2011 to get the VIX to the 48 level. This time it took just a couple of days and a much smaller decline.
Did fear get ahead of itself or did too many investors jump to conclusions too quickly?
CLICK ON CHART TO ENLARGE
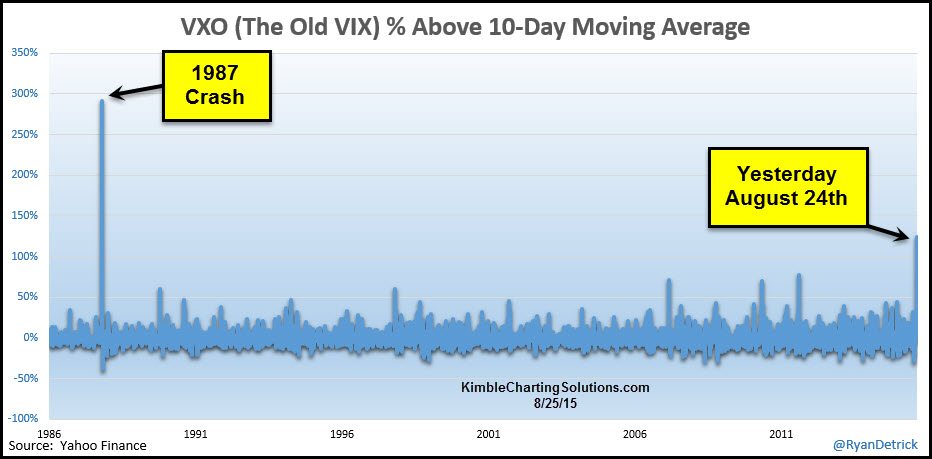
This chart from good friend Ryan Detrick looks at the fear index from a different angle. This chart looks at how much the VIX is above a 10-day moving average. As you can see, only during the crash of 1987, did the VIX get further above its 10-day moving average than yesterday. Did too many jump to conclusions yesterday morning?
Premium Members shorted this index buy owning XIV during the day yesterday. If you would like to receive trade info on the Fear Trade, I would be honored to have you as a Premium Member!
Click here for Premium Member details and Sign Up

–
