
CLICK ON CHART TO ENLARGE
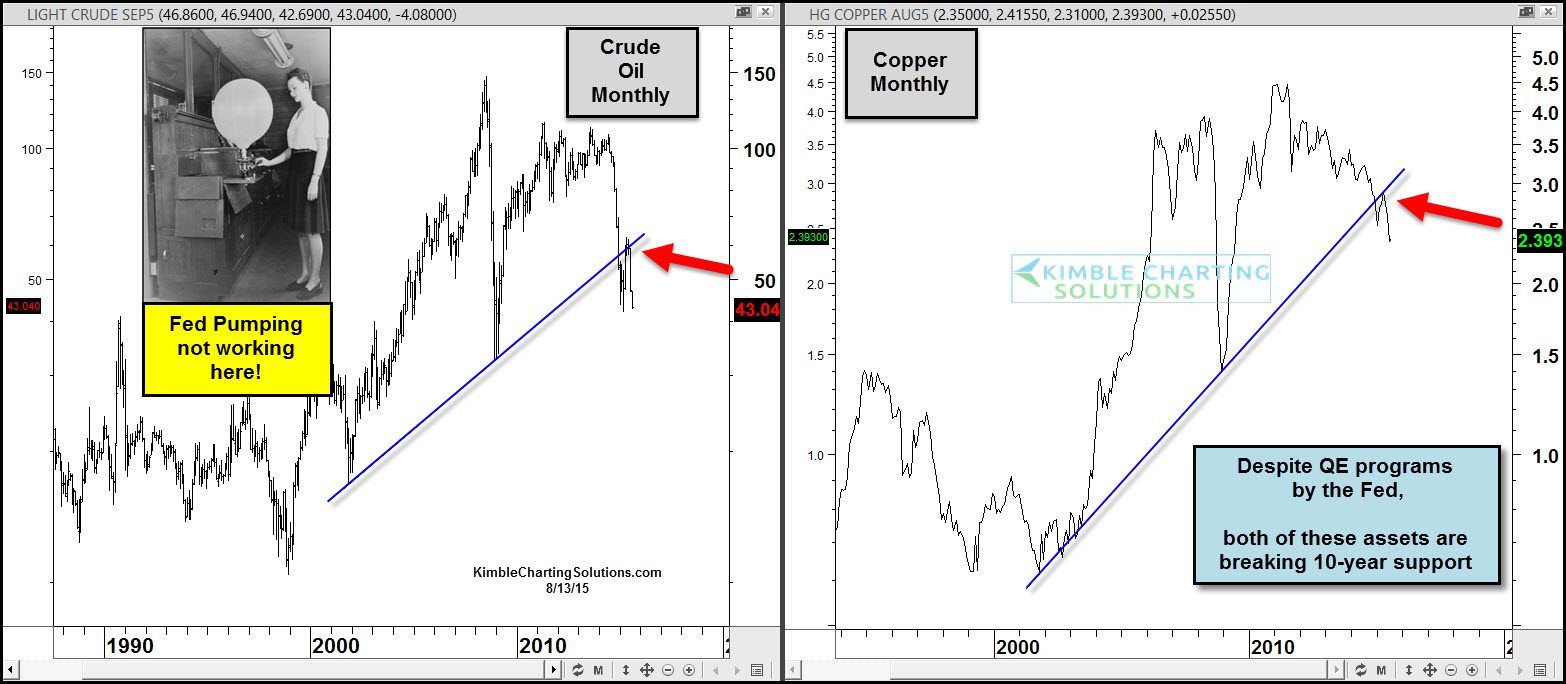
Rumor has it that the Fed has been pumping money into the economy, hoping to get some growth and inflate a few different assets.
The two charts above look at Crude Oil and Copper, going back 20-years for each asset.
Some will say that stocks are near all-time highs due to the QE programs, when it comes to these assets, neither is close to all-time highs.
Actually both are reflecting a new round of weakness, as both are breaking support lines that have been in play for nearly a decade.
Often times what Crude Oil and Copper does, is a reflection about the macro economy.
Will it be different this time? Should investors just look the other way and ignore any message coming from these two?
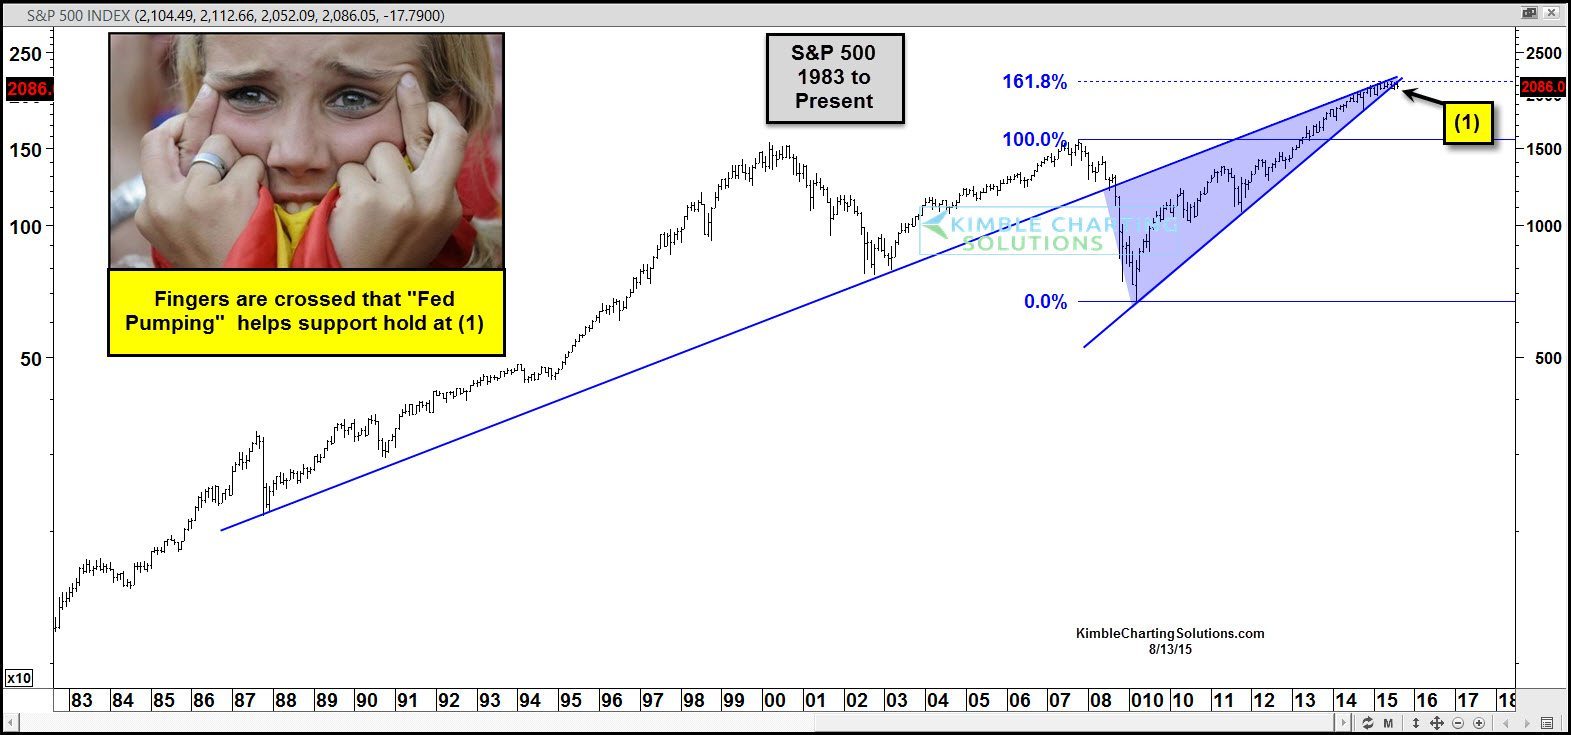
Humbly, both of these breaking long-term support at the same time does get my attention from a macro message. Below looks at the S&P 500 on a 30-year basis
CLICK ON CHART TO ENLARGE
The S&P finds itself in a pretty tight squeeze between support and resistance at (1).
Crude and Copper have broken below long term support lines. Important that the S&P stays above support or sellers could step in like they have in the commodities space, despite all the efforts by the Fed to pump things up!
–
