
 CLICK ON CHART TO ENLARGE
Barron’s has been bullish equities for a good while and they have been on track with this call!
Now they are suggesting to “Buy Commodities.” Are they on track again?
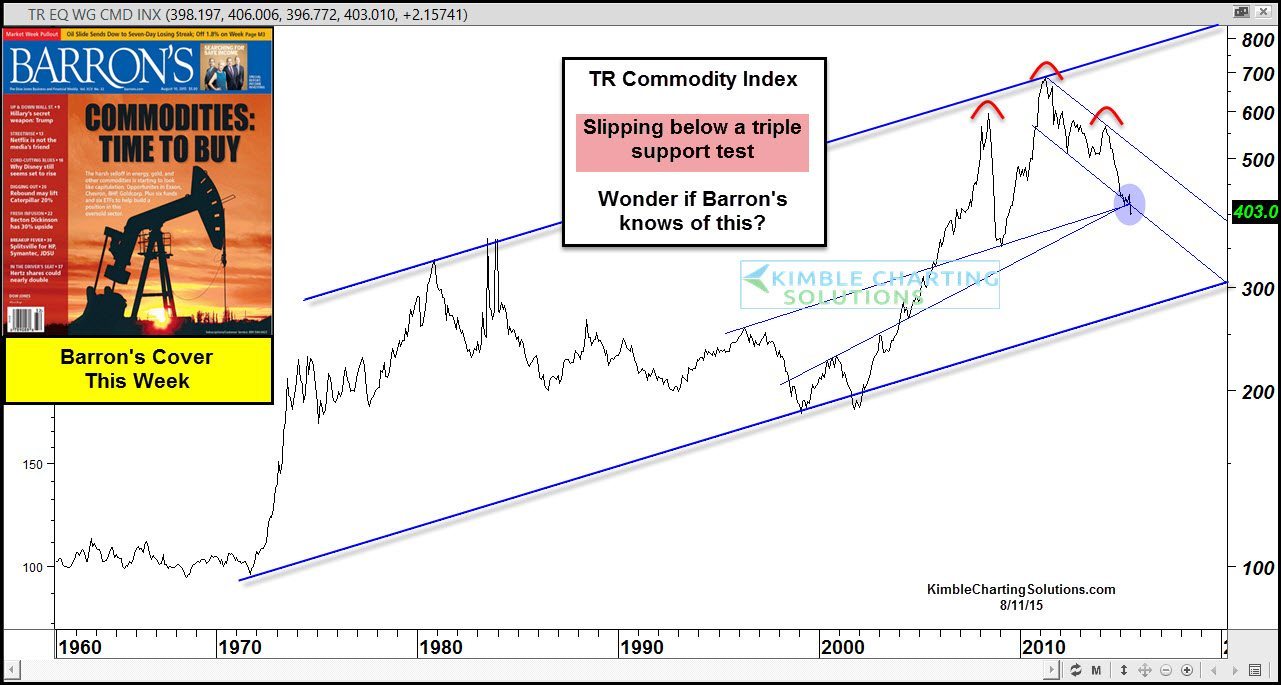
The chart above looks at the Thompson/Reuters Commodity index on a monthly basis going back to the 1960’s. Back in 2011 the index hit the top of this multi-decade rising channel and since then the index has fallen nearly 40%. Is this enough of a decline?
Of late a triple support zone has come into play for the index and it appears the index is pushing below this support level, which could be viewed as a neckline of a huge head and shoulders topping pattern.
If the “H&S” pattern read is correct and the neckline is not providing support, this commodity index could fall to the bottom of the 40-year rising channel, which is around 25% below current prices.
From a pattern perspective, it would appear pretty important that commodities find some form of support ASAP or the 4-year bearish trend in the commodities space could continue!
If the TR Commodity index continues soft, bonds might like the price action (See here)
We shared with Sector/Commodity members over a year ago that the right shoulder of a huge topping pattern looked to be in play. If you would like to stay on top of this pattern and commodities, I would be honored to have you as a Sector/Commodity Sentiment Extremes Member
Membership details Click below
![]()
–
