

Yesterday might have seemed like a boring day, but a little known event took place that is very worthwhile. Turns out, the CBOE SKEW Index hit an all-time high. Here’s from the CBOE’s website says the SKEW is. The CBOE SKEW Index (“SKEW”) is an index derived from the price of S&P 500 tail risk. Similar to VIX®, the price of S&P 500 tail risk is calculated from the prices of S&P 500 out-of-the-money options. SKEW typically ranges from 100 to 150.
In essence, the SKEW compares how much option traders are willing to pay for out-of-the money put versus call options. When the SKEW is high (like we just saw), it says traders are willing to pay anything for the protection that put options provide and thus traders are looking for perceived tail risk. In other words, many are looking for an unforeseen event that could hit stocks here. Traders are Black Swan hunting right now.
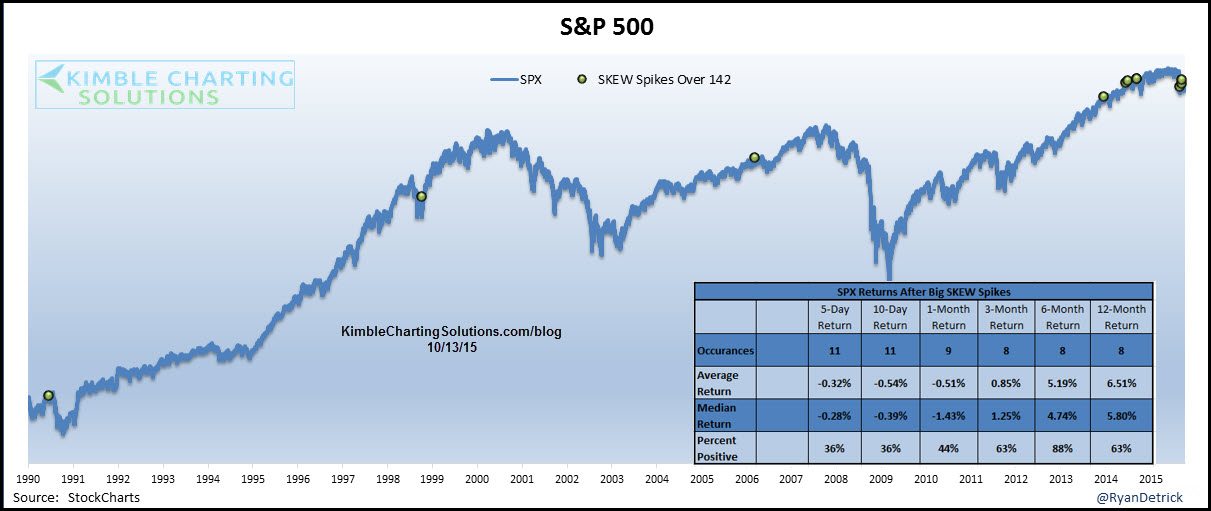
Here’s the chart of the SKEW. As you can see, the spike yesterday topped the previous record from last September

CLICK ON CHART TO ENLARGE
So option traders are looking for a potential Black Swan event. How have they done when the SKEW has spiked in the past? The spike in September ’14 came in the midst of the Ebola fears and market pullback into mid-October. Also, in 1990 there was a big spike that came ahead of about a 15% drop the next three months. But overall, I would say the fears have been overblown and by no means is this smart money.
CLICK ON CHART TO ENLARGE
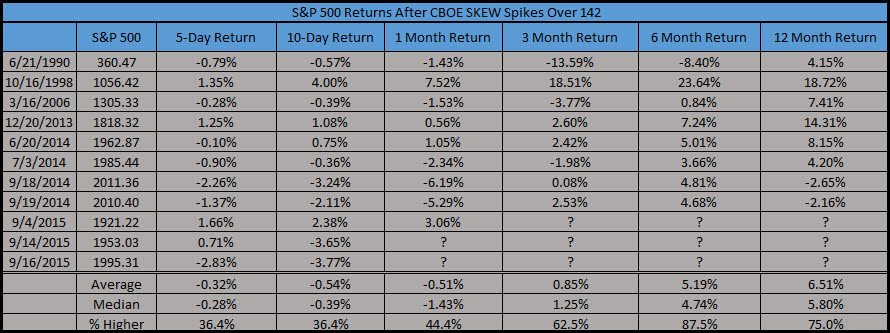
Here’s a list of all the spikes over 142 and returns after for the S&P 500. You could say 1990 was the best bearish signal and 1998 was the best bullish signal. Taking the other signals since then and the returns are rather muted going out three to six months. Not very bullish or bearish really.
CLICK ON CHART TO ENLARGE
What is worth noting is how we’d see one big SKEW spike every seven or eight years from 1990 to 2013. Yet, since 2014 they have happened with much more regularity.
Also, this recent spike took place right after a big dip in the SKEW. In fact, as of September 30 of this year the SKEW was making a new six month low and then 9 days later it was making a new six month high. That is quite rare, as the last time we saw that was October 2008 and October 1998 before that. October 2008 was down 16% and October 1998 was up 8%. In other words, extremely volatile months. Interestingly, the time before those two was in October 1997. Notice a theme here? October tends to be volatile.
What’s it all mean? Well, the VIX is down a record 10 days in a row and one might say this suggests complacency. The other side of the coin is option players are near panic here, willing to pay up for put protection from an unknown worry. My take is spikes in the SKEW have very little history of predicting major market weakness. This is a fun one to talk about and you might hear more about it the next few days, but don’t panic over this development.
Thanks for joining us today, Ryan Detrick, Head of Statistical Strategies, Kimble Charting Solutions
–
