

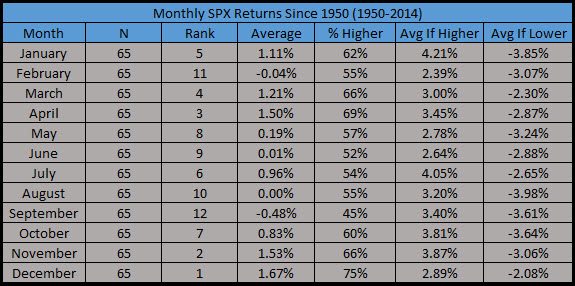
The average year has 252 trading days. This is interesting, as Wednesday was the 223rd trading day of the year. In other words, it kicked off the final 30 trading days of the year. We’ve noted many times before how the end of the year tends to be very bullish based on seasonality. In fact, since 1950, November and December are the two strongest months. Many call this late year rally ‘The Santa Claus Rally’.
CLICK ON CHART TO ENLARGE
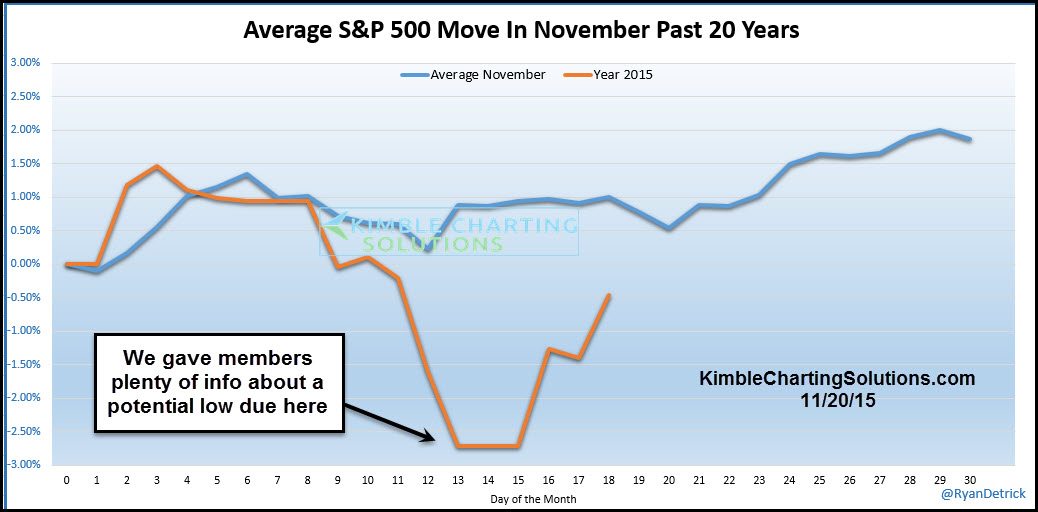
What is worth noting though, is the first part of November can be weak – before the usual late Thanksgiving strength. Here’s a chart we’ve been sharing with Members and it shows November tends to form a low around the 12th and then has a late rally. The low this time was the 13th before the recent strength.
CLICK ON CHART TO ENLARGE
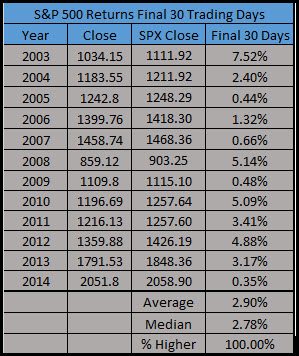
So what happens the final 30 days? Well, what stands out to us is the last 30 days of the year haven’t been lower for an incredible 12 straight years.
CLICK ON CHART TO ENLARGE
Going back to 1950, the final 30 days of the year gain an average of +2.36% with a median of +2.40%. It is also higher 75% of the time. Can’t complain with those returns.
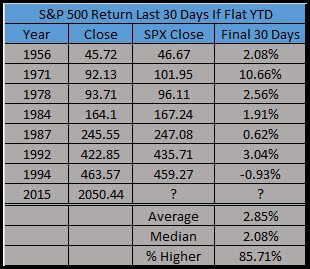
Now what does it mean when the S&P 500 is flat coming into the final 30 days (between +2% and -2%)? Wouldn’t you know it, the final 30 days actually get stronger?
CLICK ON CHART TO ENLARGE
Given Wednesday kicked off the final 30 days of the year and the S&P 500 gained nearly 1.5% this bullish seasonal period is off to a very nice start. Is Santa on his way?
Contributions from Ryan Detrick, head of Statistical Analysis at Kimble Charting Solutions
–
