

Long before last weeks Brexit vote, Germany’s DAX index has been an upside and downside global stock market leader, over the past few years. Below looks at the pattern the DAX has created over the past decade.
CLICK ON CHART TO ENLARGE
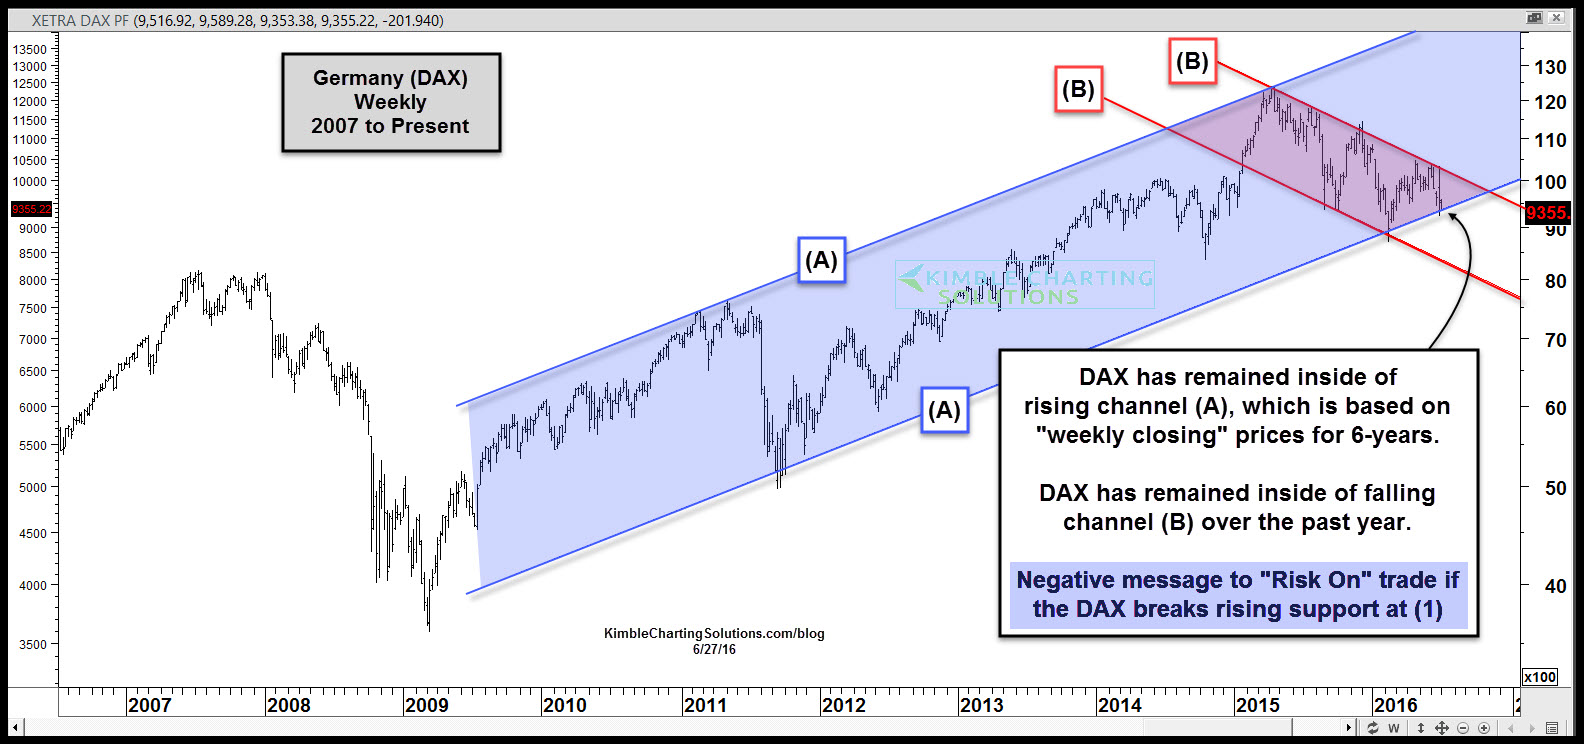
Since mid 2009 the DAX has remained inside of rising channel (A). The top of this channel was hit in April of 2015. Since hitting rising channel resistance, the DAX has started creating a series of lower highs inside of falling channel (B). So far the idea of “Sell In May” last year, has been a good strategy, in this key index.
Channel (A) is created by weekly closing prices. Last week the DAX closed just above rising channel (A) support. If the DAX breaks below rising support (A), this leader, would be breaking a trend that has been in place for years.
Below looks at the NDX 100 index over the same time period as the DAX above and how much patterns look the same. Remember this, the NDX 100 has been an upside leader (Stronger than the S&P since 2003) and it is testing 6-year support as the DAX is doing the same.

CLICK ON CHART TO ENLARGE
Similar to the DAX, the Nasdaq 100 index, remains inside of a 6-year rising channel too. Over the past year, the NDX 100 might have created a topping pattern (Head & Shoulders) pattern. The index closed right on rising support at (1) last week.
If support would give way, the next key test would be the neckline around the 4,000 level at (2).
Bottom line– Two leading indices (DAX & NDX 100) are both testing long-term rising support channels this week. The trend of higher lows and higher highs is being put to an important test this week.
If “Leadership” breaks 6-year rising support, it would be a very important trend break for the long-term Risk On trade.
Full Disclosure- Premium Members are short the NDX 100 with a tight stop in play.
–
