

CLICK ON CHART TO ENLARGE
From a Power of the Pattern perspective, Tech humbly appears to be facing the most important resistance test its faced in 2016.
The left chart looks at the NDX/S&P ratio, which reflects that tech was much stronger from early to 2013 until late 2015. Even though the S&P 500 doesn’t have much to brag about since December of last year, tech has even less to brag about.
The right chart looks at the Nasdaq 100 only, on a weekly basis. As you can see it has created a series of lower highs, since December of 2015. Potentially the NDX has created a head & shoulders topping pattern (not shown here).
Both are testing falling resistance at (1). Tech has been an upside leader since the lows back in 2002. For it to remain in a leadership role over the broad markets, buyers need to step forward and take our resistance.
CLICK ON CHART TO ENLARGE
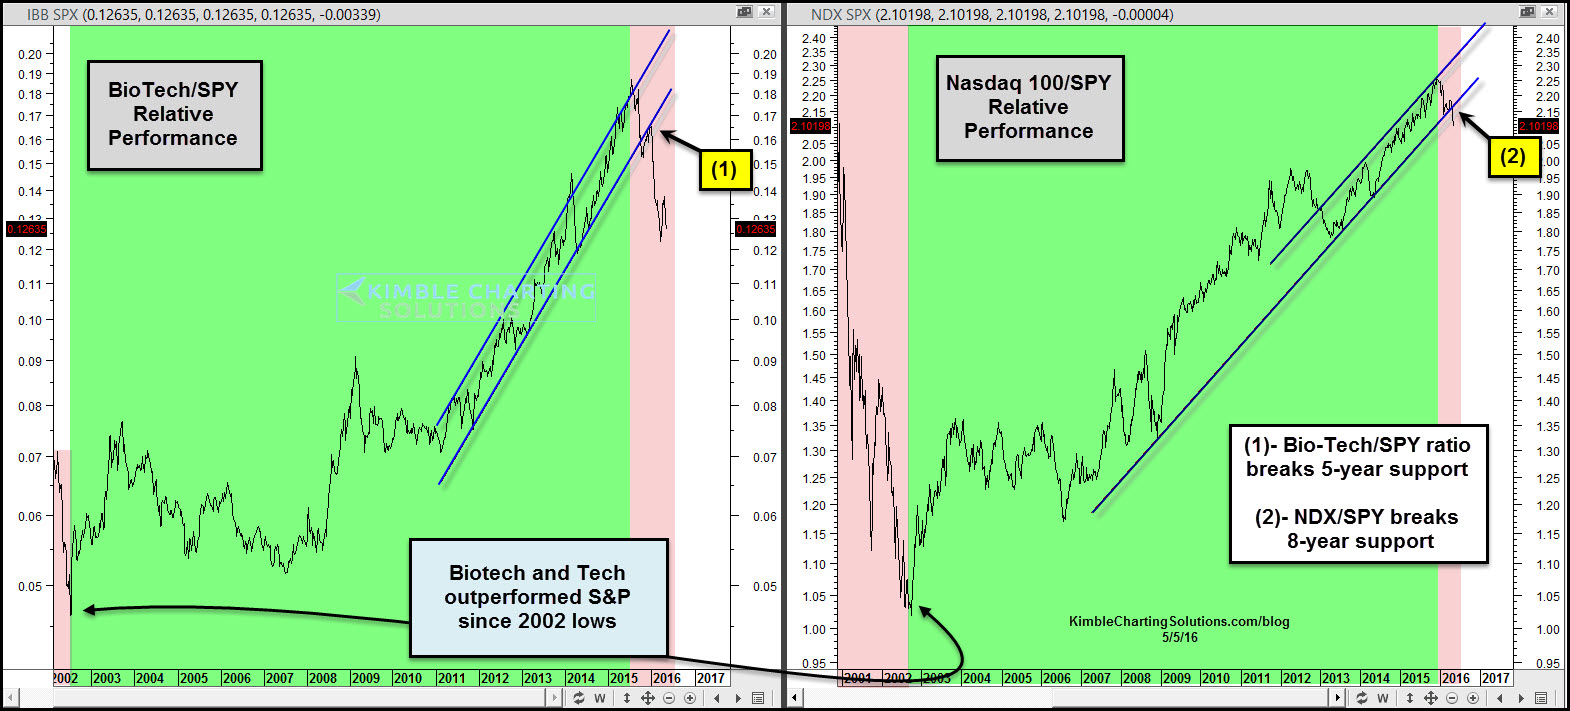
Bio-Tech and Tech have been much stronger than the broad markets for years and years. Both ratios have taken out long-term rising support lines of late.
The resistance tests that are in play right now in the top chart, don’t appear to be your run of the mill tests. Bulls would not want to see selling pressure start taking place, at falling resistance levels.
–
