
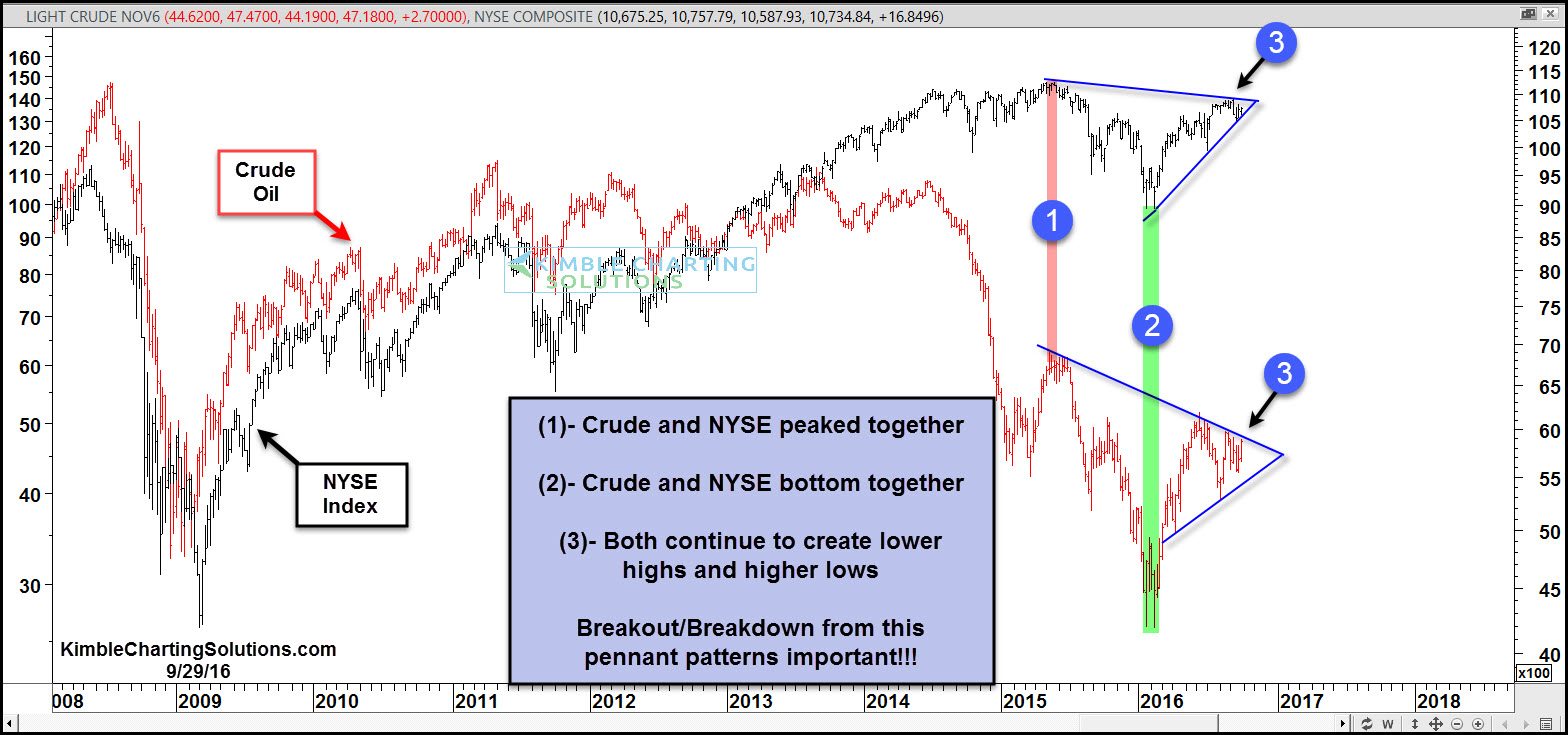
Below compares the price patterns of Crude Oil and the NYSE Index over the past 8-years. Crude and the NYSE don’t always correlate, over the past couple of years though, they have in a big way!
CLICK ON CHART TO ENLARGE
Since early 2015, the correlation between Crude Oil and the NYSE has been very high. They both hit highs together in 2015 at (1) and they both created double bottom lows together at (2).
Over the past 15-months, both appear to be creating a pennant pattern (lower highs and highs lows). These patterns tend to frustrate both bulls and bears, as the patterns are making little net progress.
Both are testing falling high resistance (top of pennant pattern) at (3) right now. The Risk On Trade in Stocks and Crude, want/need breakouts to take place. If they do, both should attract buyers.
I humbly feel, the results of these pennant patterns (breakout/breakdown), could set the tone for portfolio construction for a good while to come. The results of these patterns looks to be important on a macro basis.
