

Under Armour was a wonderful stock to own from 2009 to the summer of 2015, as it rallied nearly 1,500%. No wonder UA had become a darling of wall street and investors alike. Over the past year, if one has been long UA, its not been such a darling of a year, as UA has declined nearly 30%.
Below looks at UA from a “Log and Linear” scale.
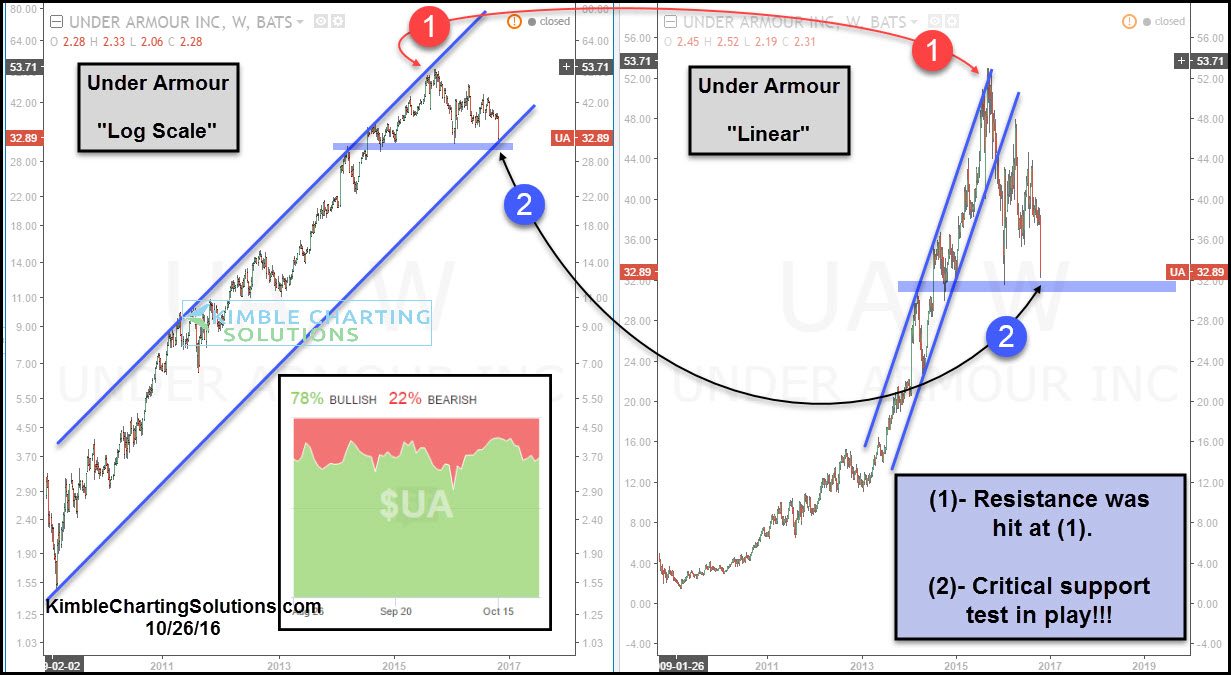
CLICK ON CHART TO ENLARGE
Both charts hit channel resistance together last year at (1), weakness then followed.
The log chart now reflects that UA is testing 6-year rising support at this time at (2). From a log scale UA remains in an uptrend, as it is still inside of this rising channel. Both charts reflect that UA is testing the lows from earlier this year.
An important test of support is in play for this wall street darling at this time. If support would fail to hold at (2), most likely selling pressure ramps up. With bullish sentiment high of this stock, this support test becomes very important for this stock.
