

Below looks at the Valu-Line Geometric Index, on a “monthly basis,” over the past 28-years. The Value Line Geometric Composite Index is the original index released, and launched on June 30, 1961. It is an equally weighted index using a geometric average. Because it is based on a geometric average the daily change is closest to the median stock price change.
CLICK ON CHART TO ENLARGE
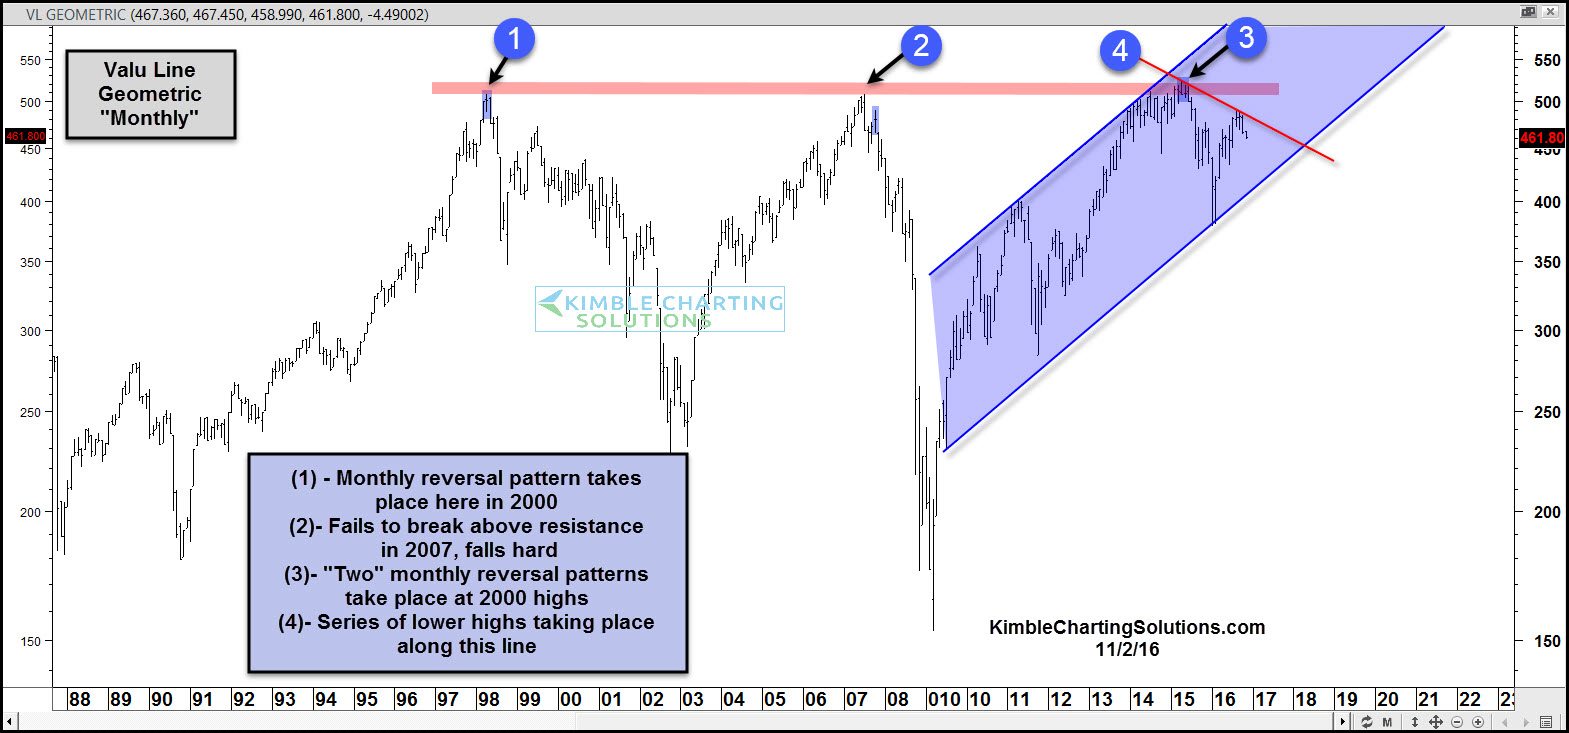
The index created a “Monthly reversal” pattern at (1) and sellers stepped forward.
The index rallied in 2007, coming up just short of 2000 levels, where selling pressure came forward at (2).
The index rallied back to 2000 and 2007 highs last year, where it created back to back monthly reversal patterns at (3). Since creating those monthly reversal patterns, the index has created a series of lower highs, just along line (4).
This index remains inside of a 6-year rising bullish channel, despite the weakness over the past 18-months. If the index would break below this 6-year rising channel, suspect selling pressure would take place.
