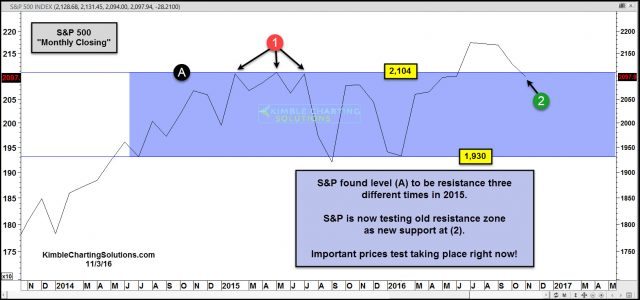
From a Power of the Pattern perspective, when old resistance is broken, its nice for assets to test old resistance as new support.
The S&P 500 appears to be doing just that, this month! Below looks at the S&P 500, on a monthly closing basis over the past couple of years.
CLICK ON CHART TO ENLARGE
This chart reflects that for the most part, the S&P 500 has traded sideways the past couple of years.
Three different monthly closes last year, took place at line (A) at each (1), which happens to be the 2,100 zone.
This summer the S&P moved above this level and now it is coming back to “test old resistance as new support at (2).
If the S&P is to push to higher levels, it is important that support holds at (2)!


