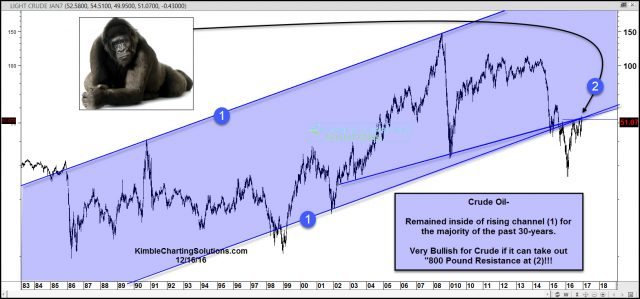
Below looks at Crude Oil over the past 30-years on a weekly basis. The Power of the Pattern feels that Crude is faced with a very rare and important price test!
CLICK ON CHART TO ENLARGE
Since the early 1980’s Crude Oil has spent the majority of the time inside of rising channel (1), creating a series of higher lows and higher highs, over a 30-year stretch.
The sharp decline that Crude underwent last year, took Crude Oil below this long term support line.
Joe Friday Just The Facts; Crude Oil is facing an 800 Pound resistance test at (2). The Power of the Pattern would suggest that if Crude can take out this resistance, it could run a good deal higher. Seldom in 30-years, has Crude faced such an important price point!
Below looks at the patterns in Crude Oil and the Transportation Index over the past 20-years.
CLICK ON CHART TO ENLARGE
The correlation between Crude and Transports sometimes can be high. Over the past year, it has been pretty tight.
While Crude is testing key resistance, Transports are testing all-time high prices, at the same time.
As ole Joe Friday said, if Crude can push past the 800 Pound resistance level, it would attract buyers into the energy space and impact other markets as well!
Full Disclosure- Premium Members have had and still do have long exposure to the energy space, with tight stops.


