

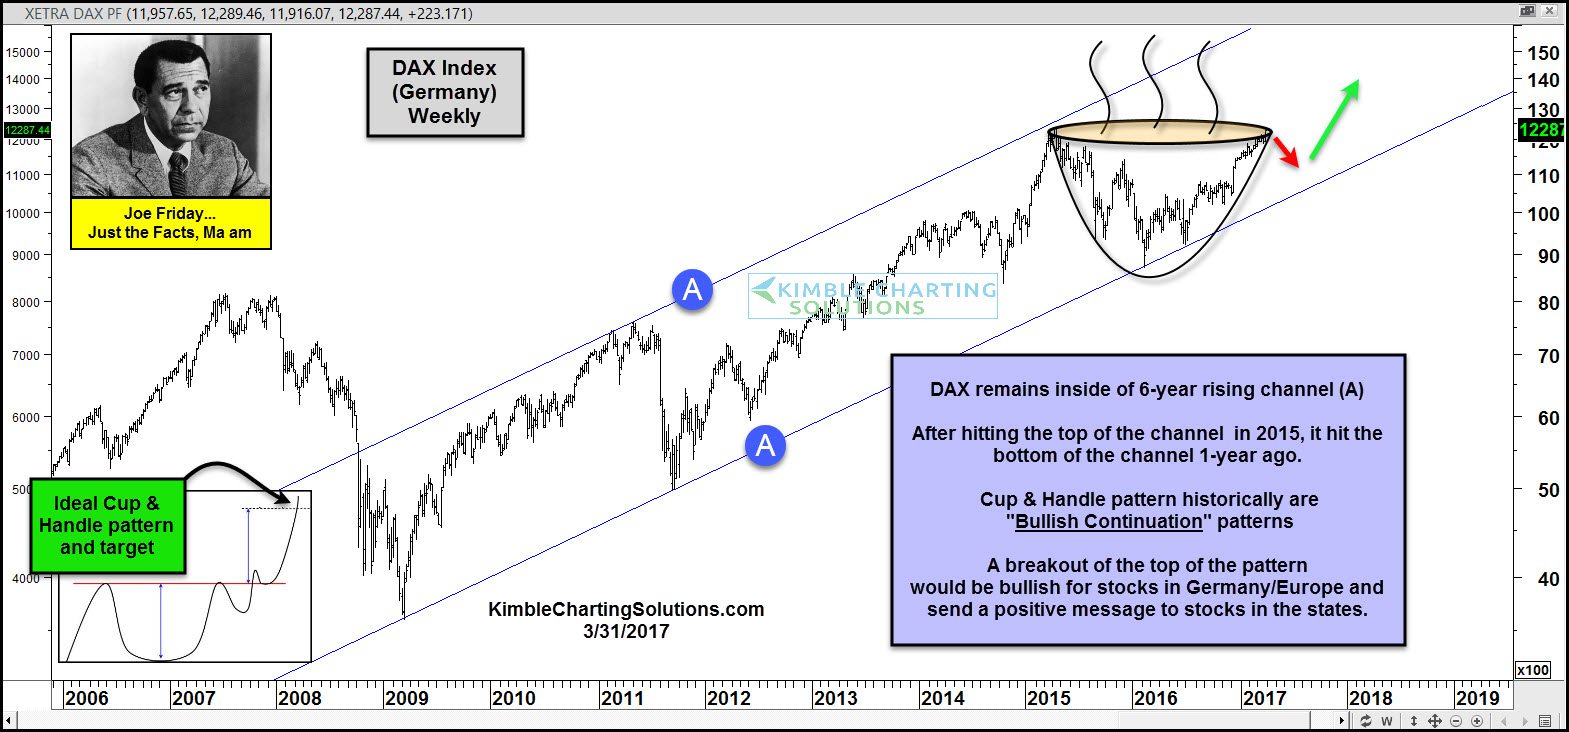
Below looks at the DAX index from Germany over the past decade. The DAX index looks to be creating a bullish continuation pattern, that the Power of the Pattern feels, is important to investors in Europe and the States.
 CLICK ON CHART TO ENLARGE
The lower left of the chart above reflects what an ideal “Cup & Handle” pattern looks like. These patterns historically take place in bull markets and are viewed as “continuation patterns.”
Below looks at the DAX/SPY ratio over the decade and why the ratio could be forming an important pattern too.

CLICK ON CHART TO ENLARGE
Since the lows in 2003, the DAX has been much stronger than the S&P 500. Since 2008, the ratio has traded sideways, reflecting that the DAX and S&P have been traded off being stronger than another, no clear winner. At this time the ratio could be forming a reversal pattern (bullish inverse head & shoulders pattern) near the bottom of a 6-year trading range.
Joe Friday Just The Facts; A breakout above the top of the Cup & Handle pattern would send a bullish price message to the DAX. Strength in the DAX has historically been a positive for stocks in the states.
Bulls in Germany and the States have fingers crossed that the DAX breaks above 2015 highs!
