

Historically when Gold is stronger than Silver, Metals bulls have not made quality buy and hold gains. Historically when Silver is stronger than Gold, both have done pretty well from a buy and hold basis.
Below looks at the Gold/Silver ratio since 2008, which reflects a very important price point could be at hand.
CLICK ON CHART TO ENLARGE
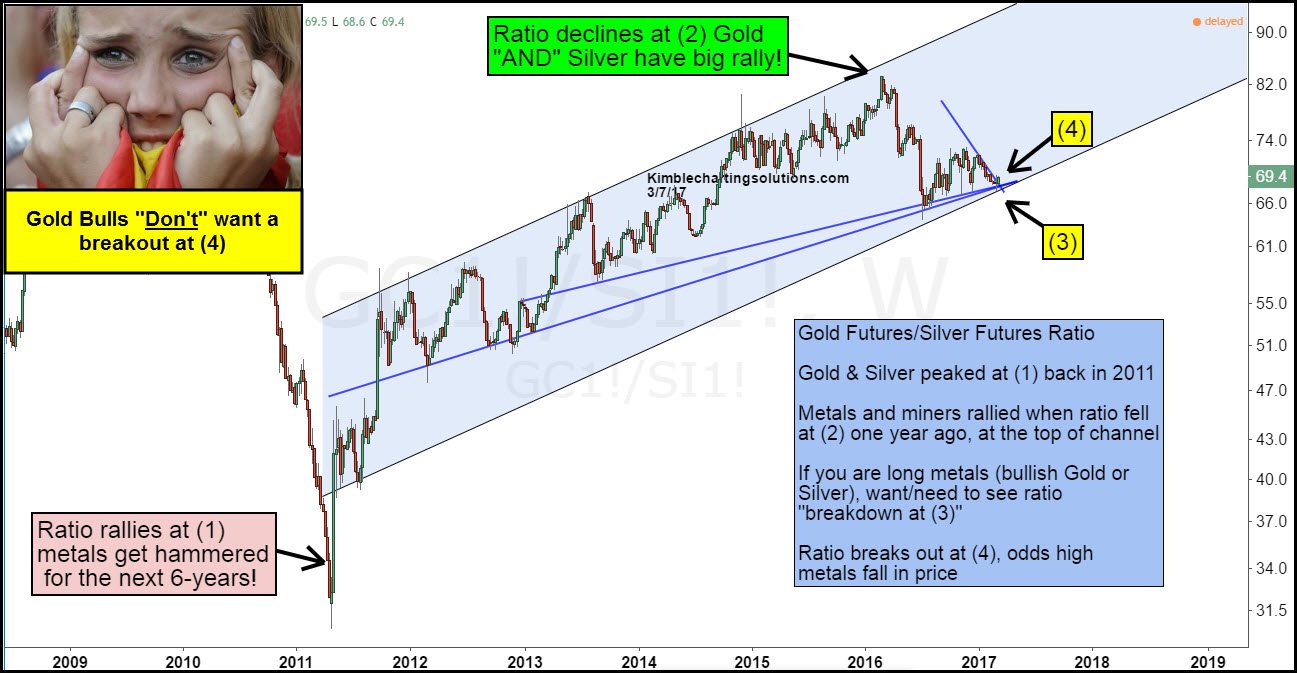
As mentioned above, when the ratio was low and turned higher back in 2011, that is when Gold, Silver and mining stocks, started heading lower for the next 5-years. This reflects that Gold is stronger than Silver, which historically is when metals struggle to make quality upside gains.
The ratio at (3) is testing a 6-year rising support line. If one is bullish Gold and/or Silver, you want to see this ratio breakdown at (3) and start heading a good deal lower (Silver stronger than Gold).
If the ratio breaks out at (4) and starts moving a good deal higher, historically it would suggest that the metals and miners sectors struggle to move higher/most likely weaker. Gold, Silver and Mining stocks bulls have fingers crossed, that a breakdown takes place!
Bottom line here; this could be a very important inflection point for the metals sector. If you would like to stay on top of the Power of the Patterns message in the metals sector, we would be honored if you were a Premium or Metals member.
