

Below looks at the performance of Silver, Gold and the S&P 500 year to date. Metals and miners are off to a good start in 2017. Even though the stock market has received a good deal of attention this year, metals have done even better. Is the performance in 2017 the start of something even bigger for Silver & Gold?

CLICK ON CHART TO ENLARGE
It’s been a long time since buy and holders have experienced a bull market in Silver. How long has it been? Silver has created a series of lower highs since 2011. The trend for Silver remains down and now it is being presented with a chance to break this important down trend.
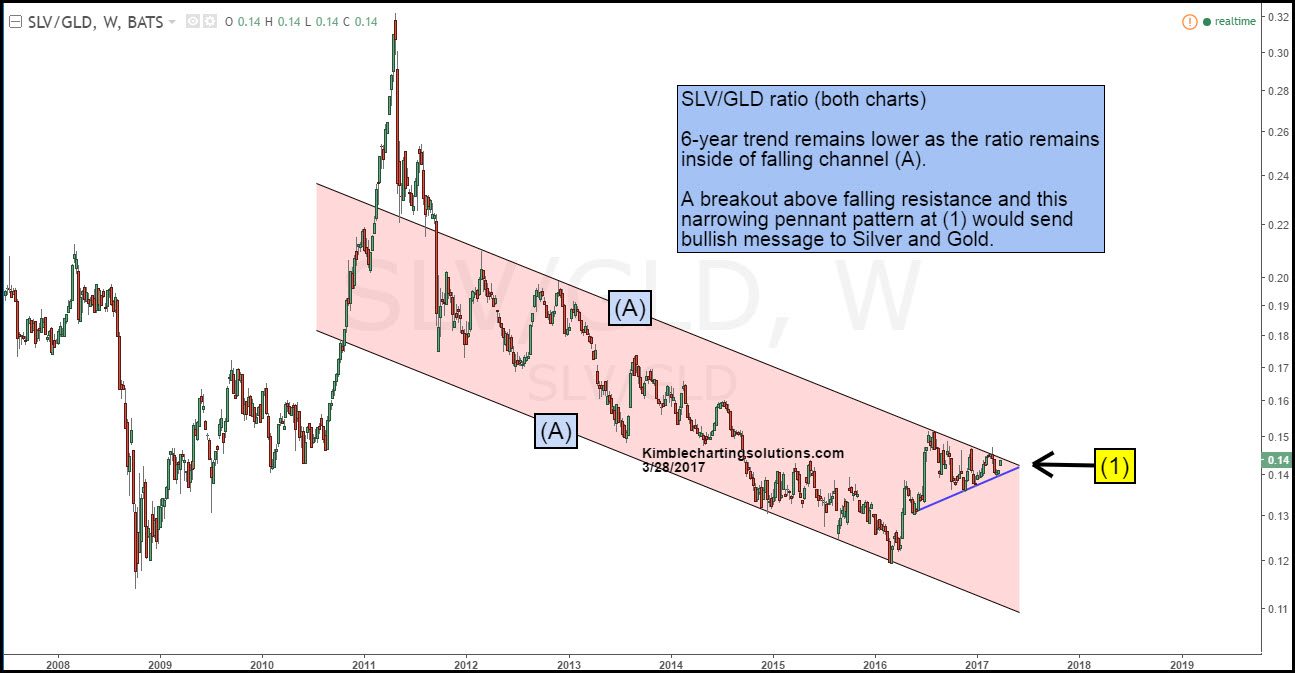
Below looks at the Silver/Gold ratio over the past 10-years. Last summer the ratio hit the top of falling channel (A) and failed to breakout. When this ratio failed to breakout, Gold, Silver and Miners turned weak.
CLICK ON CHART TO ENLARGE
Over the past 9-months, the ratio has created a series of lower high and higher lows, creating a narrowing pennant pattern, that is nearing completion at (1). The end of this pennant pattern is taking place, with the top of the pattern being the top of the 6-year falling channel.
If the bear market is to end for Silver, keep a very close eye on what takes place at (1). Premium & Metals members have played miners to the long side since 12/27/16. Even though Gold & Silver have done well, miners have done even better.
GDX is nearing falling resistance, similar to the ratio above. Members are pulling up stops on our miners positions, as the ratio above is testing one of the most important resistance/breakout tests in years. If the Silver/Gold ratio would do something it has failed to do for 6-years (breakout), it would send a bullish message to Silver, Gold and Miners.
