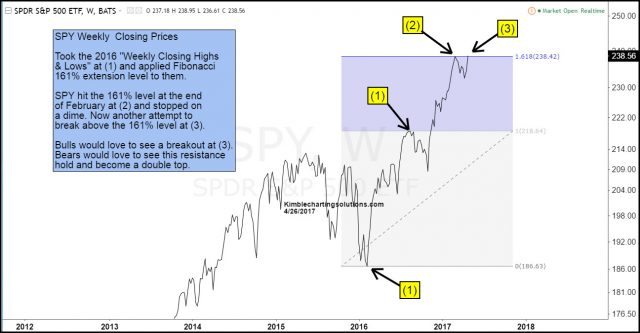
Could the “Weekly Closing Highs and Lows” of last year, be impacting stock prices in 2017? The Power of the Pattern thinks so! Below looks at the S&P 500 over the past couple of years. where we applied Fibonacci to the “Weekly Closing Highs and Lows” of last year.
CLICK ON CHART TO ENLARGE
The S&P 500 ran into the 161% extension level at (2) and it stopped on a dime, at the end of February. Following a small decline the rally the past two weeks has it testing the underside of the 161% level (238) again at (3). This test of resistance/kiss of resistance, is taking place as the “weak” seasonal time of the year, historically starts next week.
Bulls would receive positive news if SPY can breakout at (3). Bears want to see SPY double top at (3).
Running out of gas at (3), would not be good for the broad market, especially this time of the year. Keep a close eye on the 238 level! What it does here, could be very important for portfolio construction over the next few weeks and months.


