

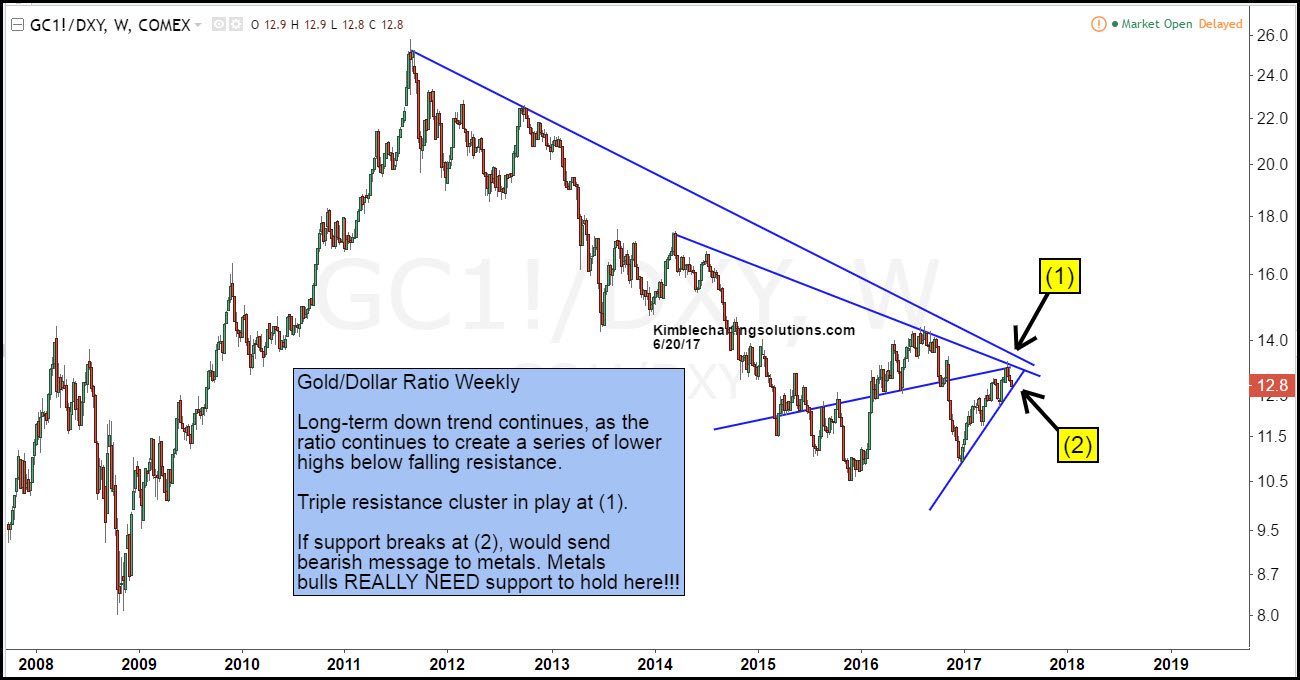
Below looks at the Gold/US Dollar ratio on a weekly basis over the past decade. The ratio peaked in 2011 and has created a series of lower highs. The ratio looks to be testing a very important price point, that could be very important to Gold Bulls.
CLICK HERE TO ENLARGE CHART ABOVE
The ratio has experienced a counter trend rally over the past 6-months. The rally took the ratio up to triple overhead resistance at (1), where the ratio so far, has stopped on a dime.
The ratio has been a little weak the past couple of weeks after testing resistance at (1). This weakness has the ratio testing 7-months rising support at (2).
Bulls want/need to see the ratio to breakout at (1), to send a bullish message that has been absent for the past 6-years.
Bulls want/need to see the ratio hold at (2). With the trend being down (lower highs and lower lows), its very important the support holds at (2)!
