

During the past 6 years, Gold bugs have seen opportunities come and go in a struggle to recoup the gold bull market magic of a decade ago. Many investors are aware of the US Dollar’s impact on the price of gold. In particular, it has been the US Dollar’s strength that has kept the yellow metal at bay for the past several years. Could this be changing?
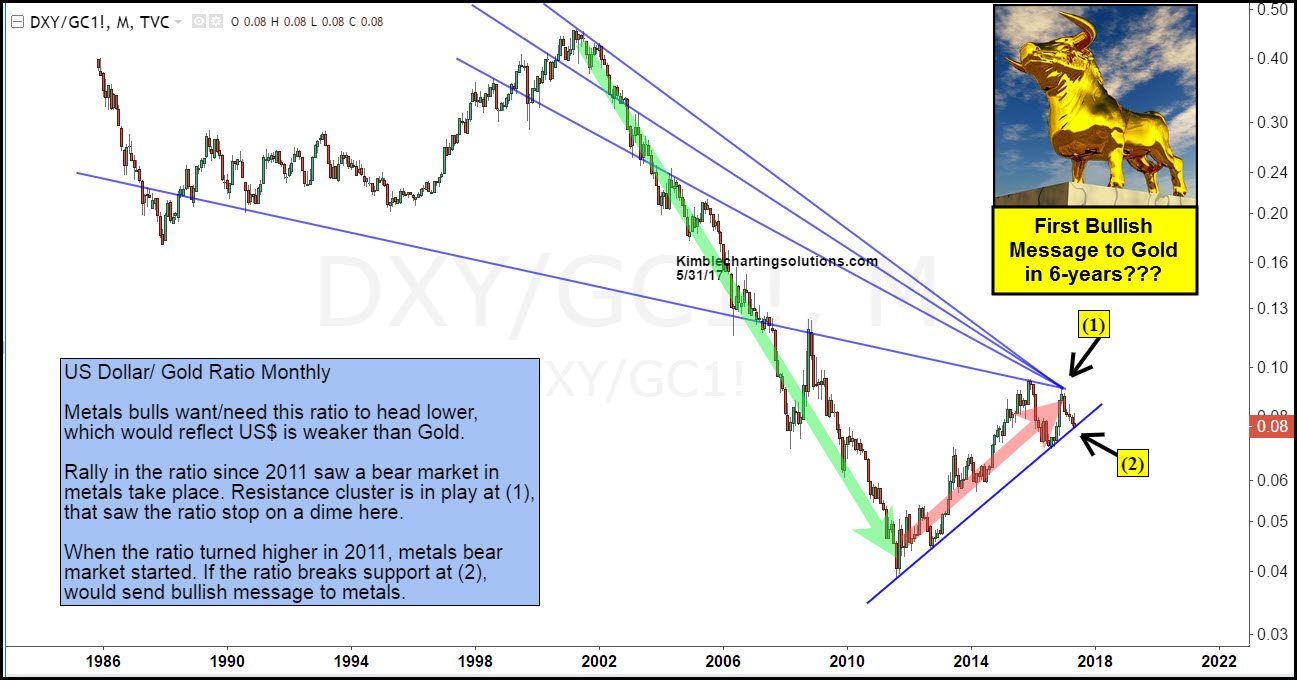
The chart below displays the relationship between the US Dollar and Gold. When the dollar is weaker than gold, the ratio heads lower… and is bullish for gold (see green line). When the US Dollar is stronger than Gold, the ratio heads higher… and is bearish for gold (see red line).
For the past 6 years, this ratio has been rising (leading to a bear market for gold and the precious metals sector). But the Dollar-Gold rally stalled at a convergence of trend line resistance (point 1). The ratio then gave way to a pullback and is currently testing its 6-year rising trend line (point 2).
If the Dollar-Gold ratio breaks support, it will send out its first bullish message in 6-years!
CLICK ON CHART TO ENLARGE
Gold bulls do not want to see this ratio find support at (2), as this rising support line has rough on metals space for 6-years. If a rally takes place at (2), it will continue to be hard sledding for metals.
In 2011 the Power of the Pattern shared that metals should be flat to down for years to come. See post HERE. We were able to come to this conclusion due to the pattern of a currency. This currency/gold pattern could be as important to metal as our call 6-years ago!
The Power of the Pattern updates this chart weekly for Premium and Metals Members. If charts like this in the metals space would be of benefit to you, we would be honored if you were a member.
This post was originally written for See It Markets. To see rest of this post, please click HERE
