

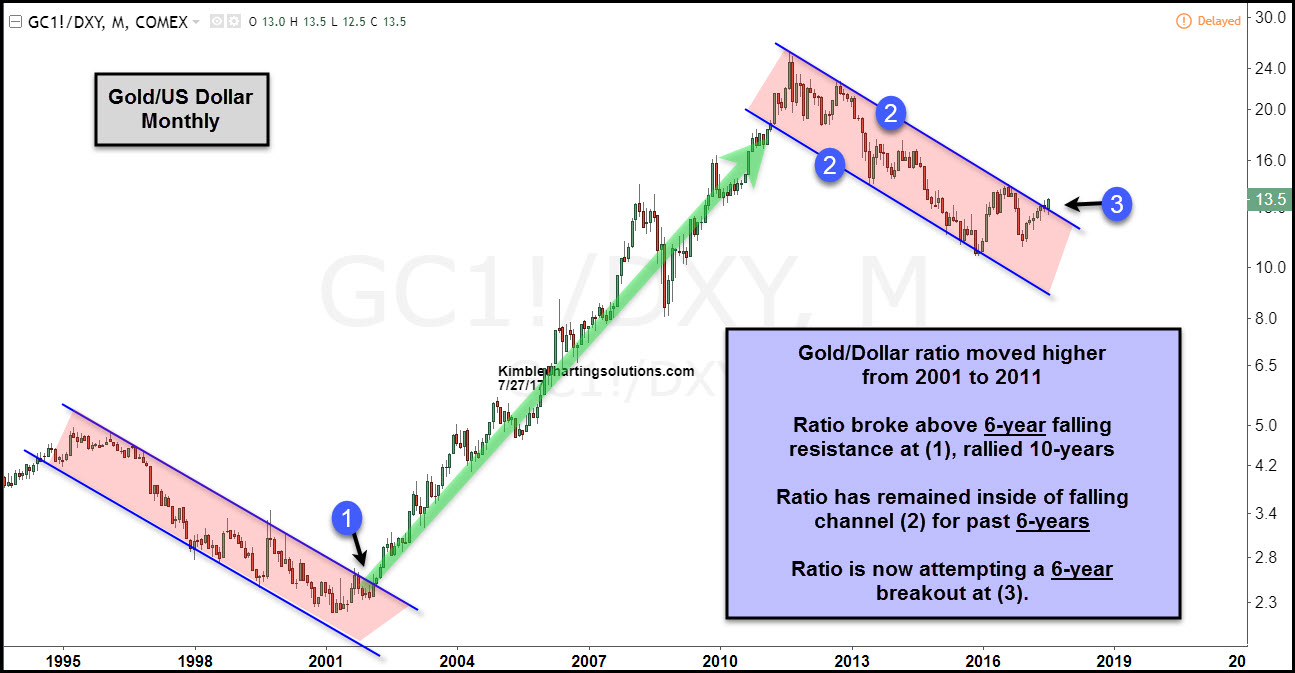
Below looks at the ratio of Gold compared to the US Dollar over the past 20-years. The ratio reflects that some long-term trends have taken place and the ratio is making an attempt to do something it hasn’t been able to accomplish in 6-years.
CLICK ON CHART TO ENLARGE
The ratio broke above 6-year falling channel back in 2001 at (1) and then it proceeded to rally for the next 10-years.
For the past 6-years, the ratio has continued to create a series of lower highs and lower lows inside of falling channel (2).
Currently the ratio is attempting to do something that it has not done in 6-years, which is a breakout above falling channel (2) at (3).
If you would like to stay on top of the Power of the Pattern thoughts in the Gold, Silver, Copper and Mining sector, we would be honored if you were a Premium or Metals member.
