
by Chris Kimble | Dec 22, 2014 | Global Dashboard, Kimble Charting
CLICK ON CHART TO ENLARGE As the year is coming to an end and the Dow is near all-time high levels, I wanted to take a peak at two different long-term perspectives. One of them Fibonacci Extension levels and the other a long-term Mega phone pattern. If one...
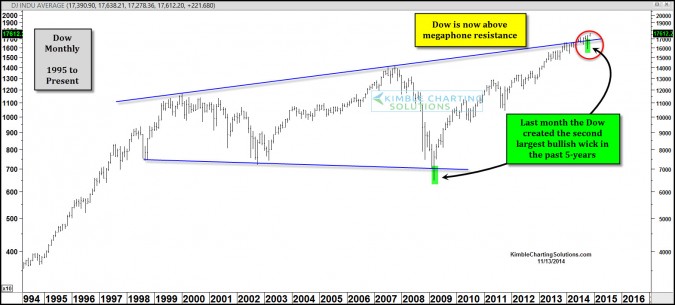
by Chris Kimble | Nov 13, 2014 | Kimble Charting
CLICK ON CHART TO ENLARGE John Melloy of CNBC writes an article in regards to the Dow pushing above the top of this mega-phone pattern and how it created the largest monthly bullish wick, since the bottom of financial crisis in 2009. See full article HERE ...

by Chris Kimble | Nov 5, 2014 | Kimble Charting
CLICK ON CHART TO ENLARGE With only 49 shopping days left until Christmas, I thought I needed to share my Christmas list. The chart above takes a 100-year look at the Dow and takes a look at a channel that has been in play since the 1930’s and a...

by Chris Kimble | Oct 16, 2014 | Kimble Charting
CLICK ON CHART TO ENLARGE The Dow has created what looks like a very large mega-phone pattern. This pattern was discussed four months ago, giving investors key big picture perspective as the Dow was hitting all-time highs (See here) The Dow over the past...
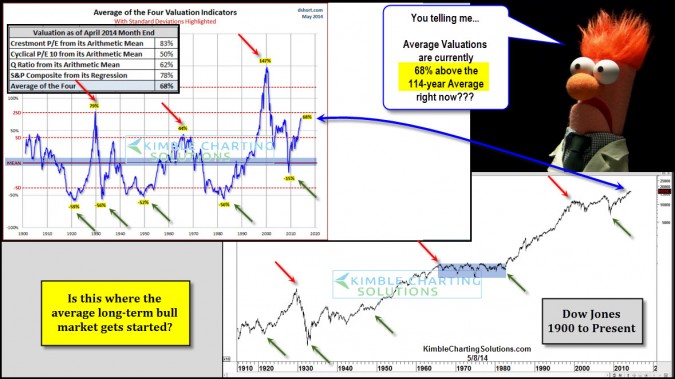
by Chris Kimble | May 8, 2014 | Kimble Charting
CLICK ON CHART TO ENLARGE The upper left chart reflects valuations over the past 114-years, created by Doug Short. This chart combines four different ways to look at valuations and then averages them together. At this time the average of the four is 68% above...

by Chris Kimble | Apr 19, 2014 | Kimble Charting
CLICK ON CHART TO ENLARGE Needless to say, the 1974 & 2009 lows were very important for the Dow. If you take these lows and apply Fibonacci to them, a 261% Fibonacci extension level at the top of a multi-decade rising channel both come into play right now...
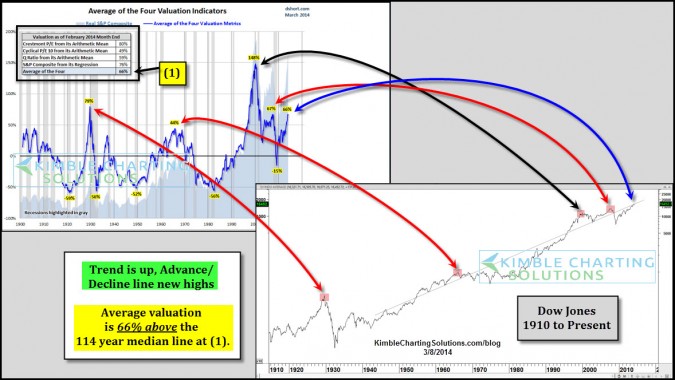
by Chris Kimble | Mar 8, 2014 | Kimble Charting
CLICK ON CHART TO ENLARGE The broad market ( Dow, S&P 500 and Small Caps) remains near all time highs and the advance/decline line is too…the trend is up. New valuations from Doug Short are out, reflecting that the S&P 500 is 66% above its...

by Chris Kimble | Jan 31, 2014 | Kimble Charting
CLICK ON CHART TO ENLARGE Dow is hitting a parallel channel line that dates back 80-years. The 2007 high hit this line and the Dow was turned back, now its hitting this line again. Not only is the Dow hitting channel line (A), it is hitting an 80-year Fibonacci...
